David Crawford welcomes fresh thinking from Canada.
Public transit improvements can bring society “significantly more value” than conventional transport models normally indicate, argues Canadian researcher Todd Litman.
“Traditional evaluation practices originally developed to assess roadway improvements, and focus primarily on vehicle travel speeds and operating costs.
“They do not generally quantify or monetise basic mobility benefits, vehicle ownership and parking cost savings, or efficient land development benefits.” He presents the case in the ‘Best Practices Guidebook on Evaluating Public Transit Benefits and Costs’, newly published by the independent research organisation The Victoria Transport Policy Institute, of which he is founder and executive director.
Among the benefits that conventional transport project evaluation “tends to ignore”, he cites:
Parking cost savings when travellers shift from driving to public transit;
Vehicle ownership cost savings resulting from transit-oriented development allowing households to reduce their needs; and Reduced numbers of road traffic accidents.
Evaluations that ignore these, he says, tend to undervalue transit and favour car-related investments. Parking pricing is one of the most effective ways of reducing car trips - typically increasing transit ridership by between 10% and 30%.
The benefits of high-quality public transit and of transit-oriented development – where communities are designed to optimise transit access, in clustered developments with good walking and cycling conditions - tend to be particularly large. They leverage additional car travel reductions, “so that each transit passenger-km results in between two and nine fewer car km”.
The guide goes on to highlight statistical evidence of direct correlations between transit availability and use, and the incidence of road traffic accidents - including results presented by researchers at the University of British Columbia to the 2012 annual meeting of the US Transport Research Board. They found that, in Vancouver, crash rates declined significantly in relation to factors including the density of bus stops; the percentage of transit-km travelled compared with total vehicle-km; and the modal share of non-car commuting.
Their modelling indicates that a strategic transport plan which encourages alternatives to private car use tends to reduce levels of fatal, severe and property-damaging collisions.
Supporting research, published in 2014 by the University of Nebraska Medical Center and the New York Academy of Medicine, analysed 29 years’ worth of data from 100 US cities. It concluded that a 10% increase in the portion of total personal travel-km made by public transit is associated with a 1.5% reduction in total traffic deaths.
Public transit can, Litman acknowledges, have significant costs, “but many are fixed, so that services tend to experience economies of scale.” Costs also tend to be relatively easy to determine, since most show up in government agency budgets.
The main evaluation challenge, therefore, is to identify all the incremental benefits. Some, he acknowledges, are difficult to monetise with available analysis tools and data, in which case they “should be quantified as much as possible and described”.
It may, for example, be impractical to place a dollar value on the benefits of transit equity (fairness to the economically, physically and socially disadvantaged). But “it may be possible to predict the number and type of additional trips that could be made by transportation-disadvantaged people, and discuss the implications of this mobility on their ability to access basic services, education and employment.”
Overall, he warns, cost benefit analysis should reflect both net and marginal impacts. For example, net pollution reductions equate to reduced car emissions minus any additional transit vehicle emissions. At the same time, marginal (incremental) impacts are sometimes difficult to determine. A 10% increase in transit passenger-km, for example, does not necessarily increase costs by 10% if additional ridership makes use of excess capacity.
Relevant ITS-based technologies such as controlled high occupancy vehicle lane access, guided busways and traffic signal priority can all help transit vehicles avoid congestion delays and travel faster. These deployments all increase transit’s operating efficiency and make it more competitive with car travel.
Transit signal priority will provide direct benefits to current users, and typically shift between 4% and 30% of car trips being made at present to transit or car sharing. “The greater the time savings, the more mode shifting is likely to occur,” says Litman.
The ‘Guidebook’ indicates that, using the recommended approach, an urban bus route attracting 200,000 additional trips a year, half of them replacing car travel, would show a benefit/cost ratio of 2.7 over a 15-year period. A transit-oriented development for 1,000 residents would show a total benefit/cost ratio of 58 over the same time span.
Further points made in the ‘Guidebook’ are that:
- Highway capacity expansion tends to reduce congestion in the short-term, but this benefit declines over time. Transit benefits tend to be smaller in the short-term, but increase over time.
- Greater major highway capacity tends to increase traffic volumes on local streets, creating more downstream congestion. Shifting travel to transit can reduce such impacts.
- Many people find riding quality transit less stressful than driving in congestion. Evaluation that ignores this can undervalue transit.
- Rail transit tends to encourage urban infill and is often a catalyst for more walkable neighbourhoods, while urban roadway expansion stimulates sprawl. Ignoring these factors can favour highway investments.
- Transit improvements tend to improve mobility for non-drivers particularly where they are a catalyst for more walkable neighbourhoods. Evaluation that considers equity objectives can favour transit over highway improvements.
- Rail transit tends to encourage urban infill and is often a catalyst for more walkable neighbourhoods, while urban roadway expansion tends to stimulate sprawl. Evaluation that considers land use planning objectives tends to place a greater value on rail transit; that which ignores these factors tends to favour highway investments.
The ‘Guidebook’ goes on to suggest that many of the approaches it recommends can also be used to evaluate other alternative modes, such as ridesharing, cycling and walking.
A second report from the Institute on ‘Affordable-Accessible Housing In A Dynamic City’, also published in May 2015, points out that households relying primarily on walking and cycling may spend less than US$1,000 annually on local transport; or US$1,500 if they use public transit and take advantage of monthly transit passes.
Lower-income motorists, on the other hand, must typically spend at least US$3,000 annually even on low-kilometrage travel. ‘Transport affordability depends on households’ ability to minimise vehicle ownership,’ says the report.
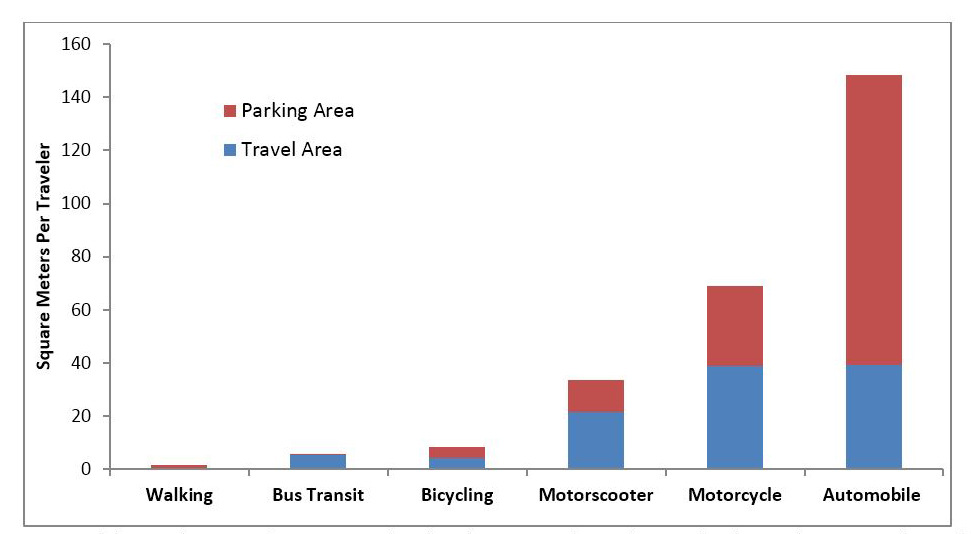
Another fresh approach involves reduced and more flexible parking (and more efficient management of it) and will recognise the value of non-private car modes as well as the significant costs of ‘abundant parking’ and the increased vehicle traffic it creates. This considers excessive and under-priced parking to be inefficient and unfair.
The Victoria Transport Policy Institute is funded primarily through consultancy or project grants and maintains the ‘Transportation Demand Management Encyclopedia’ as an industry resource on demand management strategies, planning and evaluation techniques.
Transit-oriented development
Transit-oriented development in North America envisages integrated neighbourhoods of around 2km2 in area, typically located within 800m (the distance an average person can walk in 10 minutes at 4.8km/h) of efficient public transport.
Among their travel impacts are that residents typically reduce their levels of single-occupant vehicle commuting by between 15% and 30%, about half of which transfers to transit.
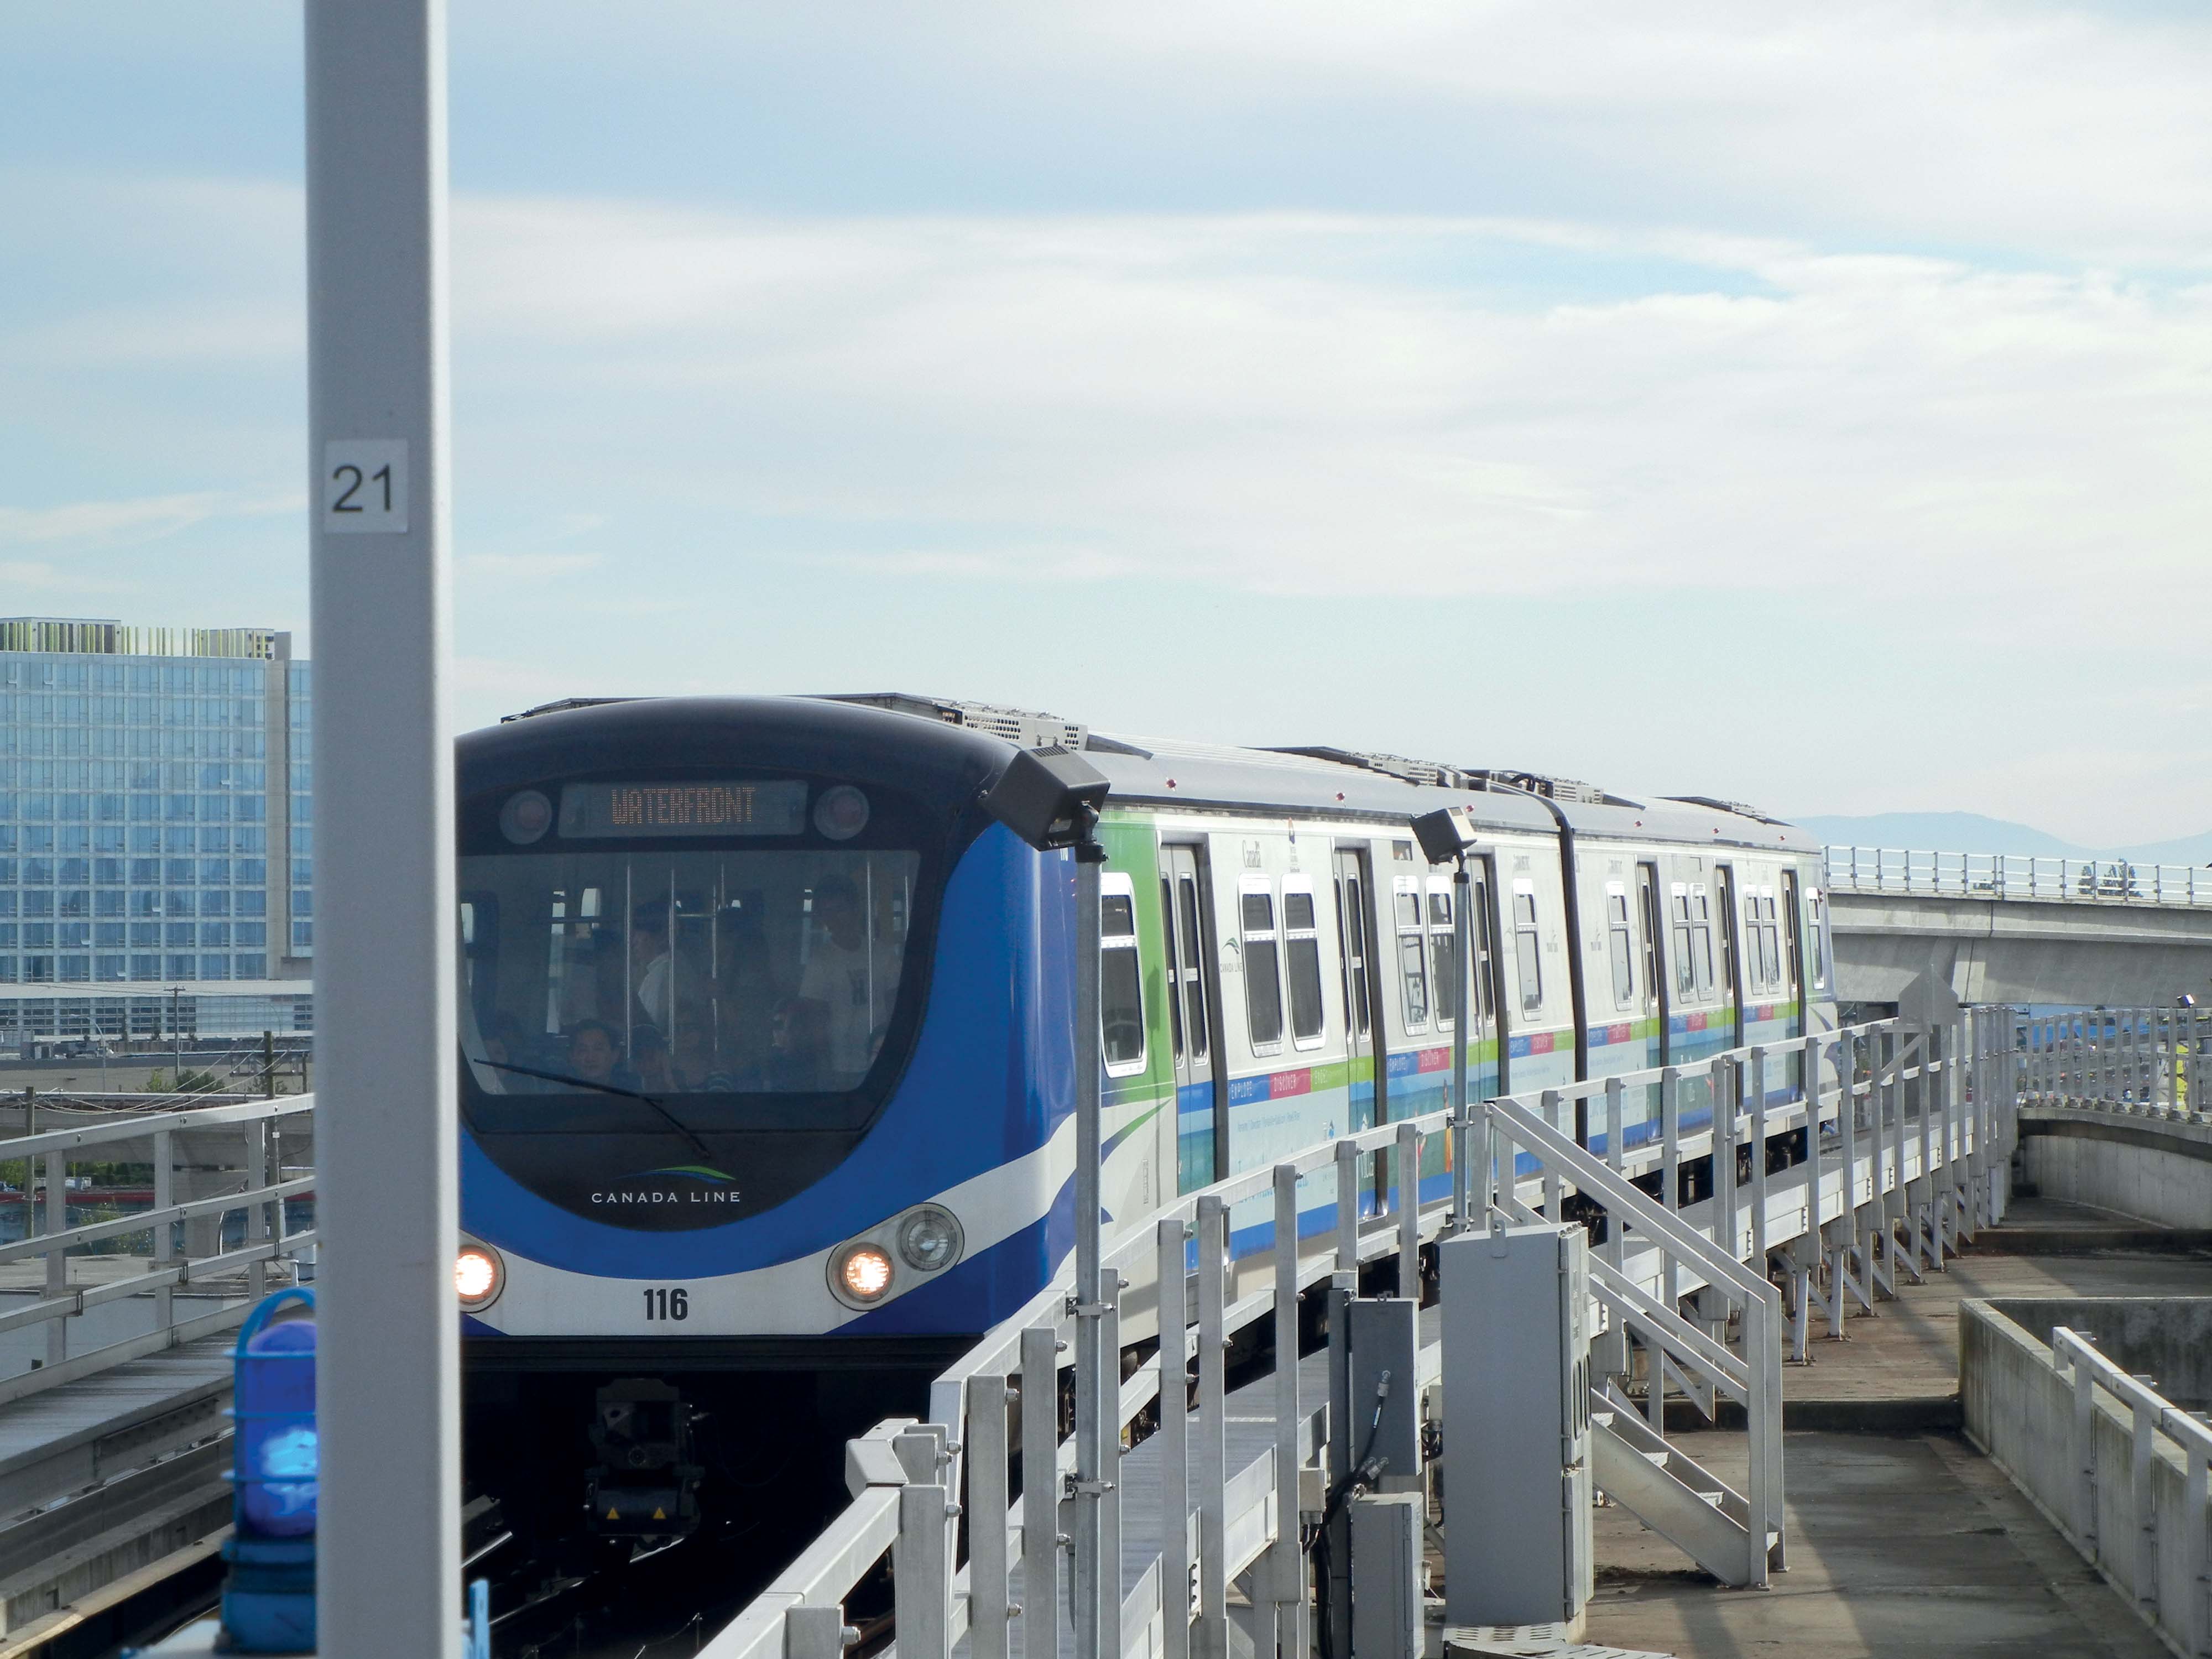
A notable current example of the approach lies in the metropolitan area of Vancouver, Canada. Its southern suburb of Richmond – the fourth largest city in the province of British Columbia - has benefited greatly from being the southern terminus of the Canada Line. This latest fully-automated link in the region’s Skytrain metro network opened in time for the 2010 Winter Olympics; it runs on an elevated track above the suburb’s main thoroughfare, with new medium-rise apartment blocks clustering around its stations. This outcome has become possible because, once plans for the route became public, Richmond’s planning directorate started work on a new City Centre Area Plan and published it before the service opened. The plan set out to deliver a network of six central-zone ‘urban villages’ as identifiable, pedestrian-scaled communities; high-density, mixed-use developments lying within at most five minutes’ walk (400m) of a transit station;
and Pacific-coast Canada’s next major office node, taking full advantage of the proximity of Vancouver Airport and five road crossings into the nearby US.


