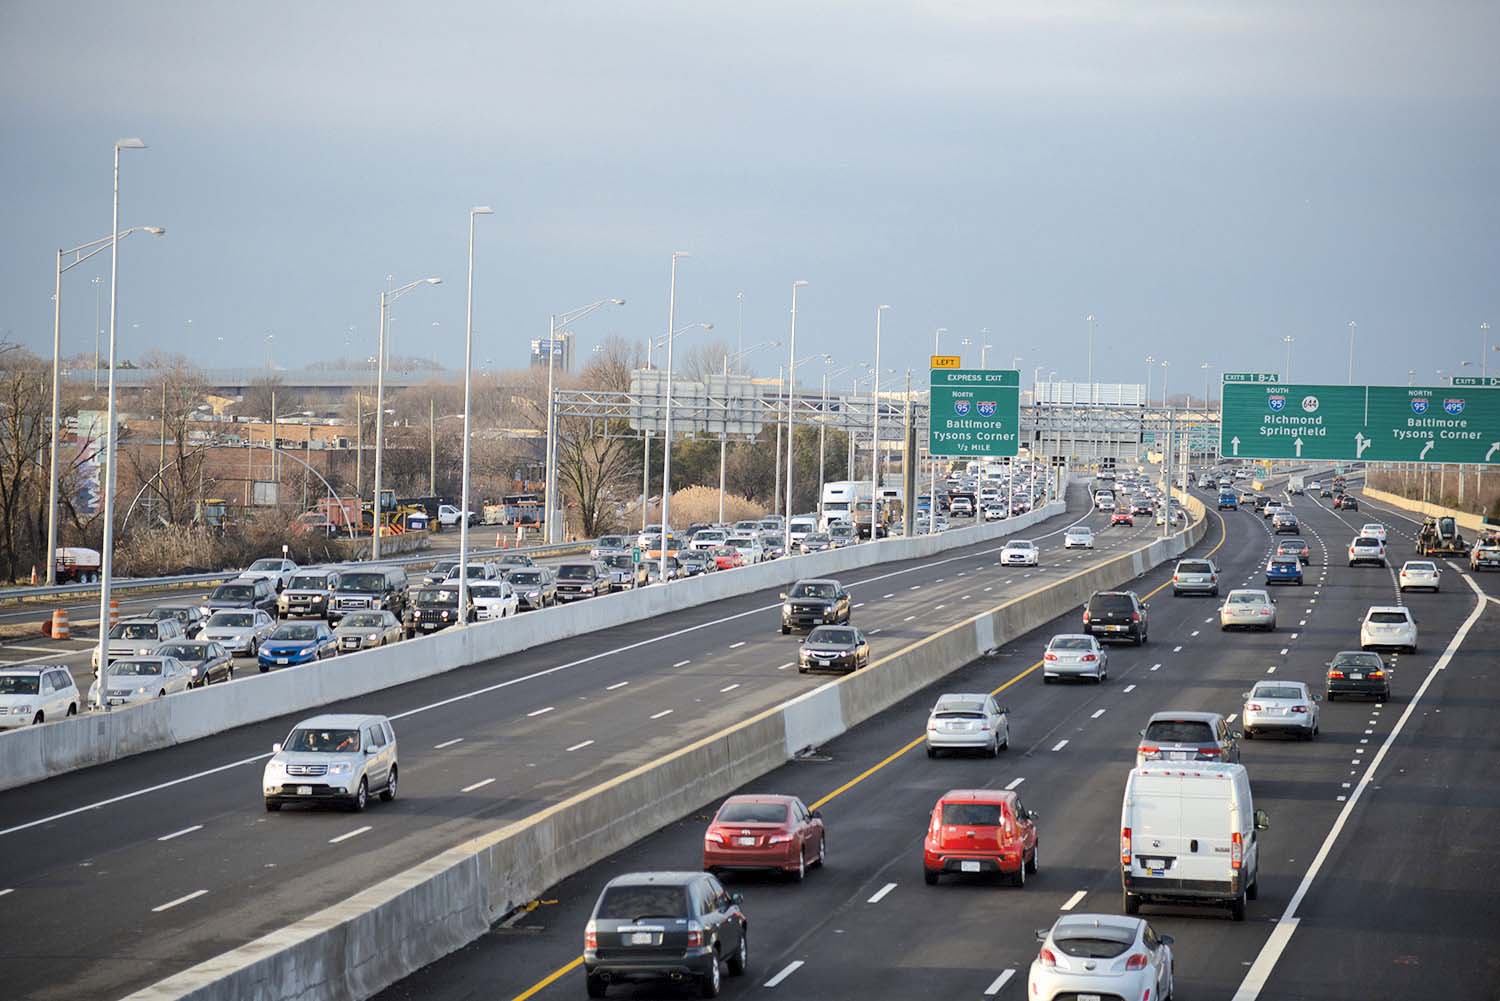
A study of the impact of travel time information on driver behaviour has come to some interesting conclusions, as Dean Deeter of Athey Creek Consultants explains.
For some time road operators have been using dynamic message signs (DMS) to keep drivers informed of current road conditions. While it is known that drivers welcome the additional information, little has been known about the effect this information has on driver behaviour - until now that is. A survey undertaken by ENTERPRISE (Evaluating New TEchnologies for Road PRogram Initiatives in Safety and Efficiency) has given an insight into drivers’ reactions to the displayed travel time messages. ENTERPRISE is a Transportation Pooled Fund (TPF) Program that includes US transportation departments, along with the American, Canadian and Dutch national administrations,In its Impacts of Traveler Information on the Overall Network Project, ENTERPRISE sought to focus on understanding the impacts that travel time messages (displayed on roadside signs as well as through web, social media and 511 telephone systems) have on drivers and the wider network. The project created online surveys linked to the traveller information portion of the Minnesota and
Because access to the survey was through the respective travel information websites, the survey cannot be statistically unbiased but none the less the information gained is useful.
In Minnesota, 91% of respondents say they have exited the highway and used another route due to longer than typical travel time displays on roadside DMS; while in Seattle the figure was lower at 71%. In Minnesota, 42.2% of respondents changed their travel plans on their last trip due to information shown on the DMS; while another 18% said the displayed travel time was longer but they remained on their original route. Travel times for the remaining travellers’ last journeys were normal.
For Seattle the figures indicate that 22% changed their travel plans and almost 20% remained on their chosen route despite some delays while the remainder enjoyed normal travel times.
However, there was a wide variation in how long the delay needed to be before drivers diverted. In Minnesota, those surveyed indicated a threshold range of 5-10 minutes longer than typical travel times was required before drivers started to divert. For drivers in Seattle to divert to an alternate route the indicated travel times needed to be 15-20 minutes longer than typical.
When asked to how much the displayed travel time needs to exceed the typical duration before they diverted to alternate routes, the surveyed drivers suggest that the threshold is approximately double the normal travel time.
| Minutes over the typical travel time | Percentage of survey respondents that described each threshold |
|---|---|
| 5 min | 25% |
| 10 min | 22% |
| 15 min | 4% |
| 20 min | 2% |
| 30 min | 2% |
| 1.5 times | 11% |
| Sign says 20 minutes or more | 18% |
| Minutes over the typical travel time | Percentage of survey respondents that described each threshold |
|---|---|
| 5 min | 16% |
| 10 min | 37% |
| 15 min | 26% |
| 20 min | 11% |
| 30 min | 11% |
To check if this was happening in practice, the study also analysed previous travel time displays and related traffic volume data (at locations downstream of the DMS) from the Minnesota and Washington State networks which confirm these thresholds. In Minnesota, four DMS locations were analysed and showed a pattern where displayed travel times more than 5 minutes longer than typical resulted in an increase in traffic exiting the freeway. When the displayed travel times were more than 10 minutes longer than typical, there was a further increase in the number of vehicles making diversions. Data from another four DMS locations in Seattle was analysed for this project although there was a smaller number of situations where travel time displays were longer than typical. Nonetheless, a pattern was observed that suggested that travel times exceeding the normal conditions by 10 minutes caused some drivers to make a diversion and even more took a detour when travel times were longer than was typical by 20 minutes or more.
While these responses appear to be contradictory, they have to be viewed in the light of differences in the road and DMS infrastructure and the messages displayed. For instance in Minnesota the signs at many locations are between 5-8 minutes apart in normal traffic conditions, while in Seattle the travel time displays describe routes with typical travel times of 15-20 minutes during normal traffic conditions. This reinforces the survey findings that when the travel posted time is double the expected duration, drivers will divert onto other routes.
Survey responses also indicate that travellers in Seattle are more willing to divert to (or remain on) arterials than they were willing to divert to freeways.
While it might appear logical to conclude that it is not worth displaying delays which are less than twice the normal travel time, in fact the opposite is true.
| Description | Percentage of traffic staying on Hwy 36 | Percentage of existing at Dale Street |
|---|---|---|
| Before construction | 89% | 11% |
| During construction NO travel time posted | 79% | 21% |
| During construction travel | 84% | 16% |
| MPH | Traffic diversion from Mcan No travel time on DMS | Traffic diversion from Mcan Display travel times >10 min higher than usual |
|---|---|---|
| <5 | 14% | 24% |
| 5-7.5 | 14% | 18% |
| 7.5-10 | 11% | 12% |
| 10-15 | 16% | 12% |
Stopped or very slow traffic speeds at locations in the vicinity of an exit ramp leading to a viable alternate route resulted in a higher number of drivers taking diversions. However, where DMS travel time information was available in addition to drivers observing stopped traffic, the impact was significant as drivers tended to divert less often when not warranted with displayed travel times close to normal and vehicle speeds faster than 5mph. Equally, drivers tended to divert more often when it was warranted with longer travel times displayed and speeds slower than 5mph. In short, information from the DMS helped drivers make better decisions about when it was advantageous or not to divert.
These findings give a first indication of drivers’ reactions to a variety of travel information messages across multiple delivery mediums which create traffic management opportunities to predict traveller route changes when increased travel times are displayed on DMS. With such information traffic controllers can, for instance, alter signal timings to accommodate the increase in vehicles leaving the highway and to display additional ‘wayfinding’ message displays on these alternate routes.
This research also offers a glimpse of the predictability and impacts of crossing travel time diversion thresholds in the era of connected vehicles and personalised information delivery.
• Dean Deeter is president of Athey Creek Consultants who conducted the research and managed the project. The public sector project managers representing the ENTERPRISE Pooled Fund on the project were Bill Legg, ITS operations engineer with Washington State DOT, and Brian Kary, freeway operations engineer with Minnesota DOT.
Other findings
Other findings of the survey indicate that approximately 19% of the respondents in Seattle check travel times on the website to decide which route to take while 63% use it to check the conditions for an upcoming trip, select the best route and decide whether to change departure times.
Residents of Minnesota were more enthusiastic web users with 40% checking travel times to decide on their route. Slightly more (45%) checked the website for road conditions, route selection and deciding on a departure time. More than half (54%) of respondents in Minnesota checked the travel website every day while in Seattle the figure was less than half that level at 25%.
DMS and websites score the highest when it comes to driver’s preferred method of receiving information with, surprisingly, smartphones pushing in-vehicle navigation systems into fourth place. While Seattle and Minnesota disagree on preferences between 511 telephone and social networking outlets, both methods achieve less than half the score of the front runners.


