Data is everywhere in transportation systems and in copious amounts. But what is your data telling you about your agency? And are you putting it to use to run your agency better? Xerox is helping agencies make sense of data they already have so transportation managers can find patterns, trends and solutions. During the 2012 ITS America annual meeting, Xerox will showcase a ‘city dashboard’ including heat maps that illustrates transit activity in a city.

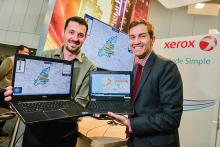
John C. Handley, Principal Scientist at Xerox showcasing the ‘city dashboard’
Data is everywhere in transportation systems and in copious amounts. But what is your data telling you about your agency? And are you putting it to use to run your agency better?
4186 Xerox is helping agencies make sense of data they already have so transportation managers can find patterns, trends and solutions. During the 2012 ITS America annual meeting, Xerox will showcase a ‘city dashboard’ including heat maps that illustrates transit activity in a city.
As public transit operators continuously look for ways to increase capacity and optimise services using analytics to determine how people are using mass transit, so agencies gain the insight necessary to make intelligent route adjustments which result in better use of available resources.
Modern fare collection systems based on contactless cards and connected to central management systems open transportation systems to new opportunities in the ‘big data’ era. Every transaction contains useful information.
Using this data Xerox is able to visualise travel demand in combination with GIS, its evolution over time, the characterisation of geographical areas based on boarding patterns, the estimation of origin-destinations matrices and the estimation of vehicle load solely based on fare collection boarding events.
Building on OrbCAD, Xerox’s CAD/AVL data analysis and visualisation system, Xerox is able to visualise passenger count data so that transit managers can understand which legs of routes are productive and when. Using passenger counts and transit analysis with demographics allows operators to comprehend passenger flows and helps agencies transform their data into actionable insight that allows them to improve people’s lives.
%$Linker:


