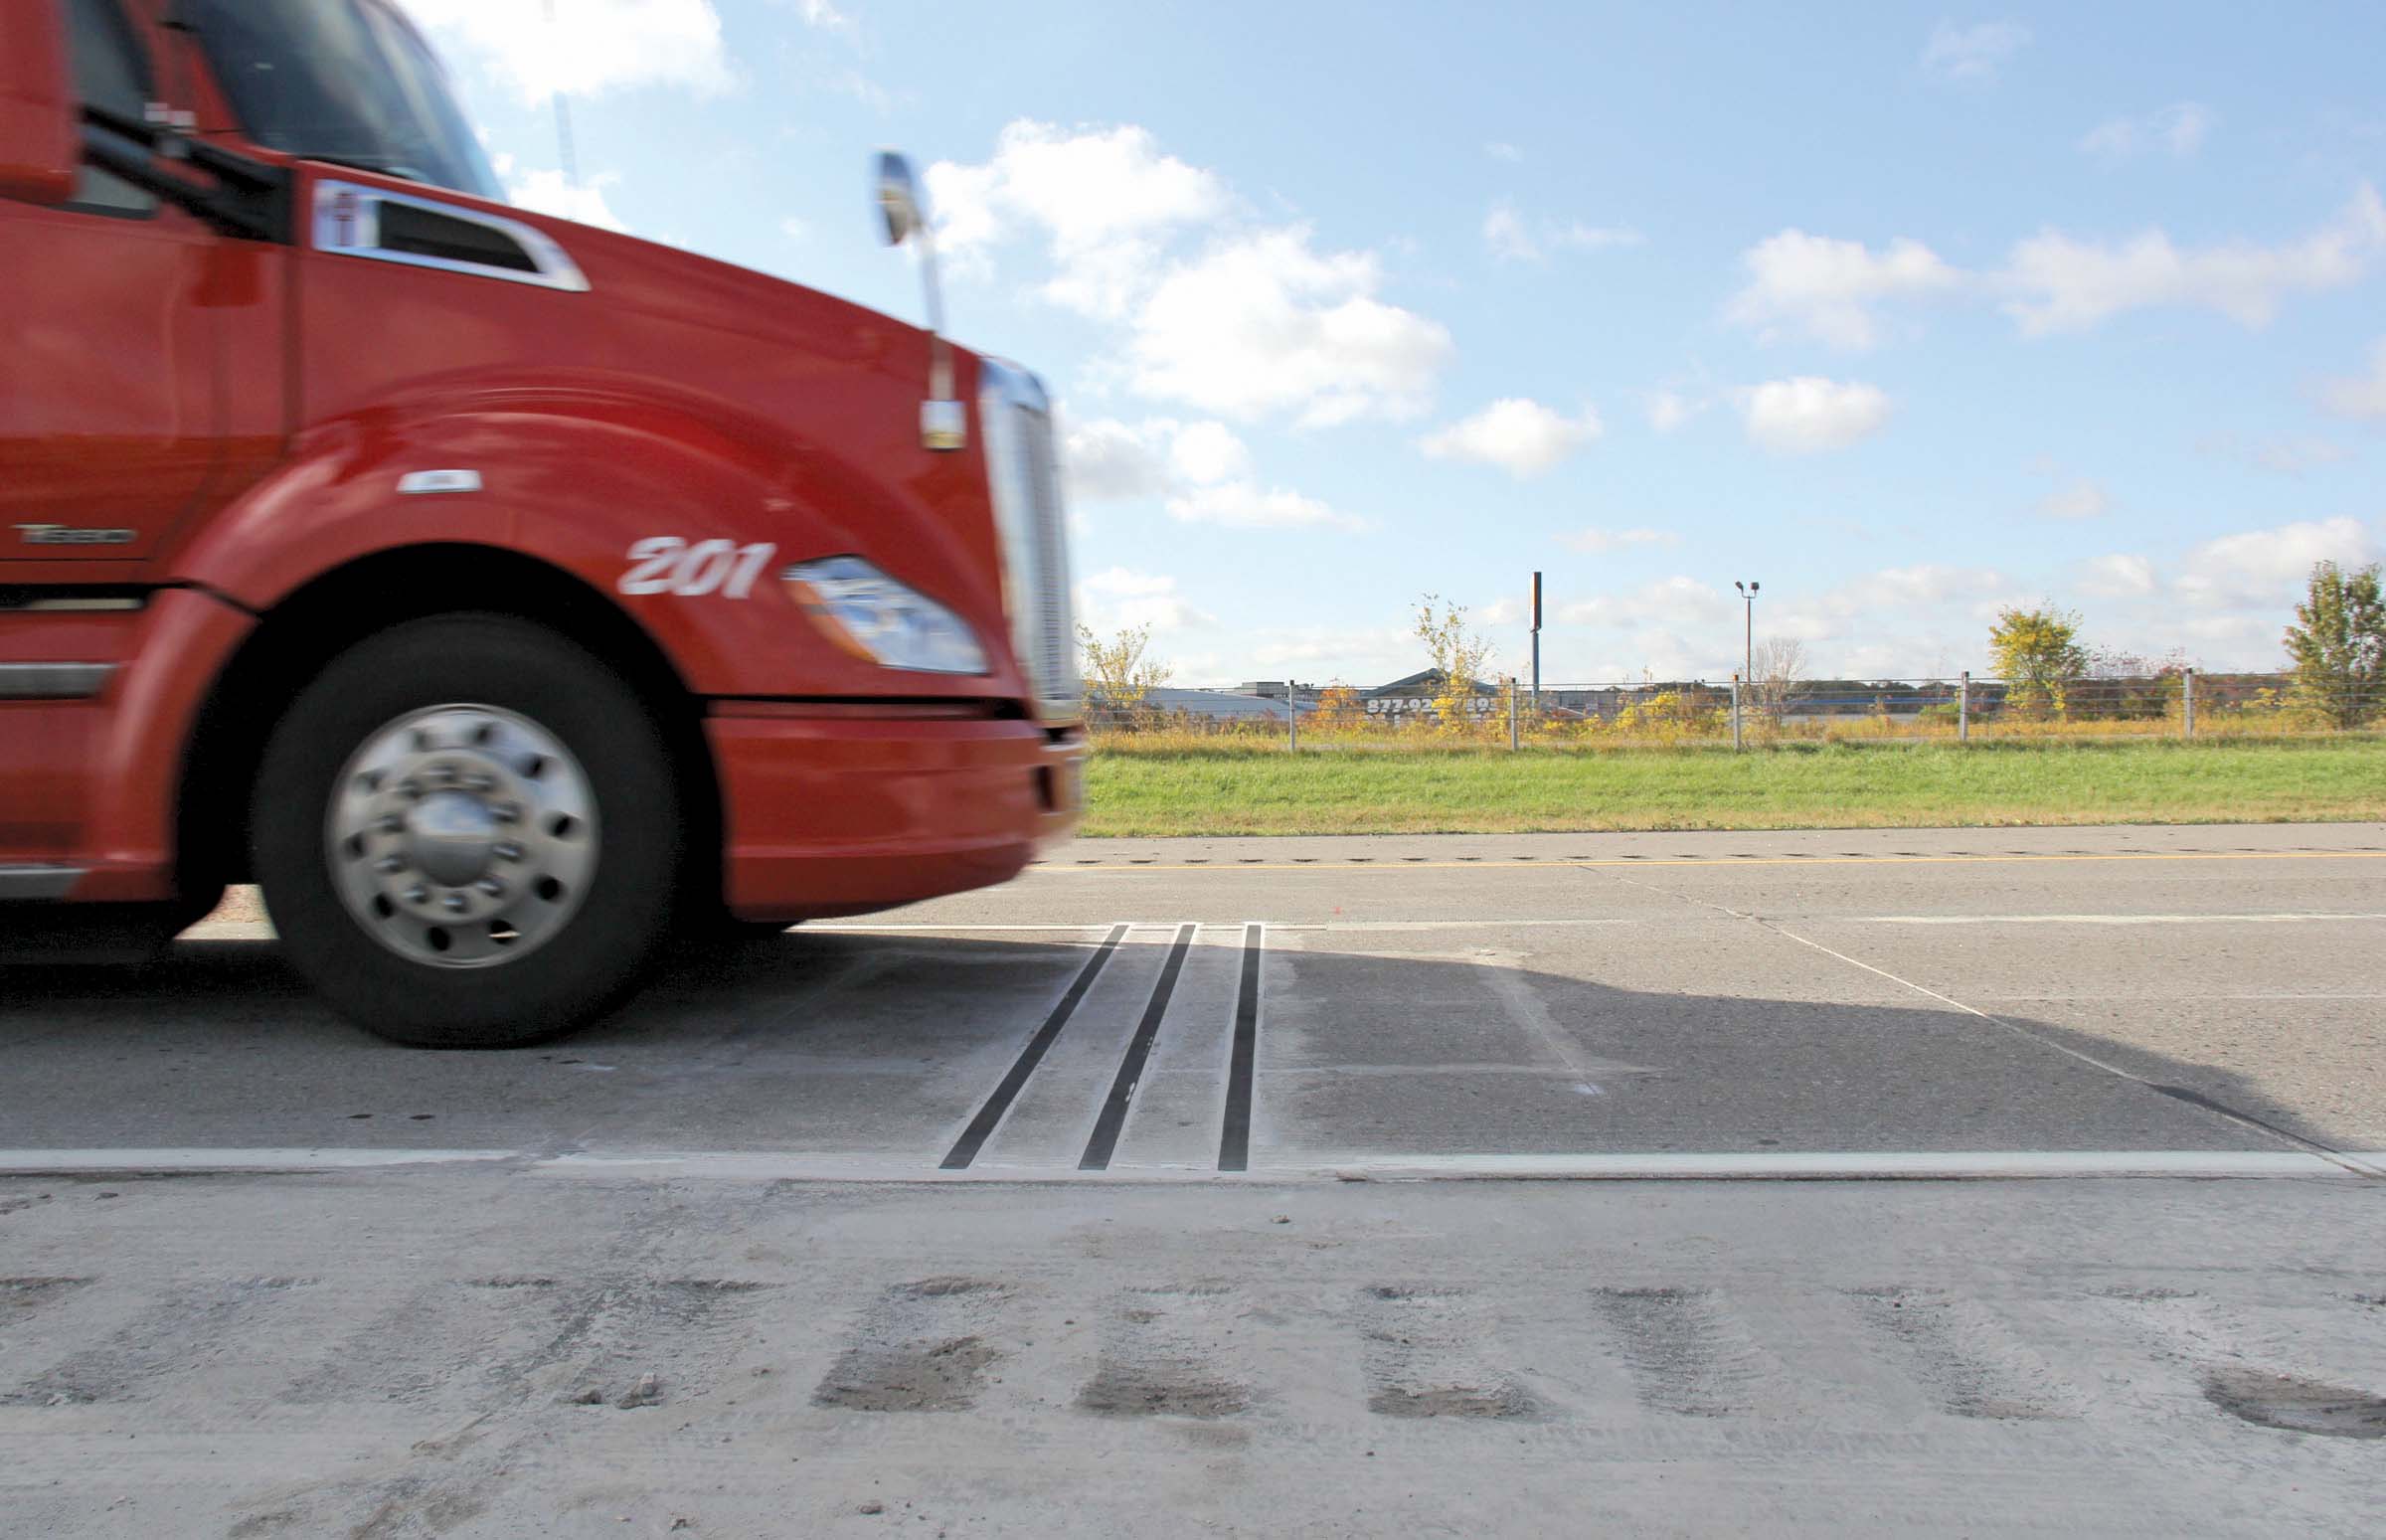
IRD is at ITS America 2016 San Jose to showcase the VectorSense tyre sensor suite for traffic and pavement design applications in conjunction with the VI²M data collection and presentation software suite.
The VectorSense tyre sensor suite is a new in-road sensor technology that provides vehicle position and individual tyre footprint information for use in traffic data collection programs, commercial vehicle operations and toll road operations. This additional and advanced vehicle data provides for differ

Rish Malhotra of IRD
The VectorSense tyre sensor suite is a new in-road sensor technology that provides vehicle position and individual tyre footprint information for use in traffic data collection programs, commercial vehicle operations and toll road operations. This additional and advanced vehicle data provides for differentiation between single standard, ‘super single’, and dual tyre width configurations – vital information for predicting pavement damage.
VectorSense sensors provide data on all types of vehicles, enabling engineers and planners to collect and analyse traffic data to optimise infrastructure investments such as bike lanes, bike paths and bike share locations. With input from VectorSense sensors, IRD says the VI2M data collection system can provide web-based reports on different tyre configurations and vehicle types. VI2M can detect all types of vehicle configurations, including bicycles, motorcycles, three-wheeled vehicles and oversized vehicles with non-standard axle arrangements.
VI2M provides an easy-to-use web-based system of dashboards that graphically represents data stored in a central repository. In addition to tabular reports on vehicle classes and axle counts, the system can generate plotted graphs for lane position, wheel measurements, and wheel type at multiple sites.
The software suite allows users to combine data from multiple sensor types and multiple locations to create a complete picture of activity across their jurisdiction.


