Colin Sowman talks to Matthew Pencharz, the man charged with charting London’s path between catering for traveller needs, conserving ancient buildings and conforming to modern air quality standards.
Every city has its own particular problems when it comes to transportation and, increasingly, air quality; none more so than London - administratively Europe’s largest city with a population of 8.4million. City planners have to contend with integrating today’s commerce amid a wealth of historic buildings and manage traffic travelling along roads originally built for horses and carts. And now the city’s authorities are under increasing pressure to improve air quality; not only as a moral imperative but also because the European Union is poised to fine the UK for repeatedly exceeding allowable pollution levels in London and elsewhere.
Weighing up the problems and potential solutions is Matthew Pencharz, senior advisor for environment and energy to London Mayor, Boris Johnson. Pencharz said: “London’s air quality challenge is easily the greatest in the UK but it is far from being alone in the UK, Europe and elsewhere in the world. Even relatively small cities can have serious air quality challenges.”
London’s population has been increasing by 100,000/yr and in the early 1990s (before the position of London Mayor was reintroduced) the UK’s Department of Transport created no-stopping Red Routes in the capital. Although these make up only 5% of London’s total road length they carry more than 30% of its traffic. Investment in public transport by the existing and previous London Mayors has meant the increase in population has not been reflected in a corresponding increase in congestion.
“A large redistribution of the road space, previously to buses under Mayor Livingstone and now to cyclists with Mayor Johnston, means the city hasn’t seized up and there has also been a reduction in London-based car ownership. While we recognise that many Londoners will continue to need cars, we are focused in large part on public transport development and ensuring people can get on trains, underground and buses.
“In London we are doing more than any city in Europe, and arguably the world, to try to address the air quality challenge and we are on top of eight of the nine regulated pollutants. NO2 is the one that’s causing us most difficulties; PM10 [small particulate matter below 10 microns] is also difficult although we are just about on top of that one.”
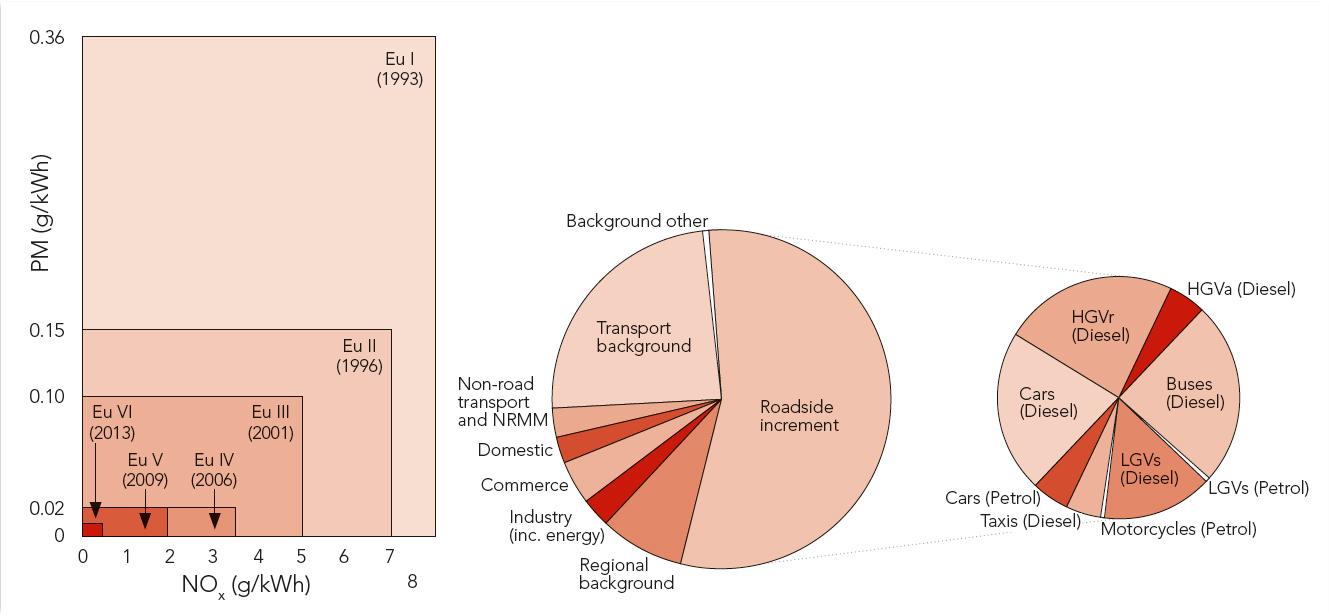
Around 40% of London’s NOx (which includes NO2) and PM10 pollutants come from sources outside the capital. In 2008 a low-emission zone (LEZ) was established under Mayor Livingstone which surcharged commercial vehicles that did not meet certain emissions limits. Recent analysis of NOx emissions shows that road transport across London contributes around 50% to total NOx, and in central London buses make up a third of this. TfL’s 8,000 strong bus fleet is the single biggest contributor followed by taxis and diesel cars.
“Since the current Mayor was elected we’ve tightened vehicle standards in the LEZ so all vehicles except private cars and motorcycles have to meet a certain standard for PM and we’ve just finished making our bus fleet even cleaner. It was already the world’s cleanest fleet for its size and we have retired some of the older buses early and retrofitted a large number with additional exhaust equipment so they release less NOx and NO2 (see box).We’ve also brought in age limits to take older taxis and minicabs off the road.
“The numbers of Londoners living in areas which exceed the NO2 limits have halved from around 3.6m in 2008 to 1.7m – although that obviously indicates there is still a problem. Many of the air quality hot spots are adjacent to traffic lights so there are issues to do with traffic flows. If we can have fewer vehicles braking, accelerating and idling at junctions we can to a degree mitigate the air quality impact so we have been installing the SCOOT [Split Cycle Offset Optimisation Technique] traffic lights.”
SCOOT technology which changes signal timings dynamically depending on traffic levels and has been shown to reduce traffic disruption by between 8% and 12%. By the end of 2018 three quarters of all traffic signals will use the SCOOT technology.
As part of a Pedestrian Safety Action Plan, TfL has already announced that audible alerts or tactile rotating cones for visually impaired pedestrians will be installed at all traffic lights with a pedestrian phase by 2016. And new or upgraded pedestrian crossings will look to include Pedestrian Countdown and their use will be expanded across all 33 London boroughs in the coming years.
“The countdown timers show pedestrians how much time they have to safely cross the road and this also has the effect of allowing a few more cars through which eases congestion,” said Pencharz.
“In its evidence to the EU Commission the government said the UK won’t meet the NO2 limits by 2030 or beyond; we [in London] reckon we can bring that forward to 2020. The Mayor can do two thirds of that largely through the Ultra-Low Emission Zone (ULEZ), a buildings retrofit programme and the introduction of construction equipment requirements.”
This non road traffic measures come about because analysis indicates that 39% of NOx emissions come from non-road mobile machinery and 24% from non-domestic gas appliances.
“We are driving a large buildings retrofit programme to reduce emissions from boilers… and new standards on emissions from construction equipment used in the capital. We also have a big urban greening programme which is planting trees in London streets to suck up pollution which is very exciting because beyond improving air quality, it makes the area a nicer place to live and work.”
The construction equipment requirements will come into effect in 2015 as a condition of granting planning permission and from 2018, all newly licenced black cabs will have to be zero emissions capable.
However, Pencharz said the key to tackling the air quality problems is the proposed ULEZ which will continue to have the same boundaries as the current Congestion Charge scheme. By 2020 the scheme envisages a £10 surcharge on all diesel vehicles entering the ULEZ unless they meet the latest Euro 6 emission standards (which have just taken effect) and, unlike the existing scheme, it will include passenger cars and motorbikes.
Both the Congestion Charge and LEZ schemes use the same ANPR-based enforcement system. In the case of the LEZ the captured registrations are cross referenced to provide details of the vehicle’s age, from which the relevant emissions compliance is derived.
Still under consideration are the times the proposed ULEZ scheme will be operational. If implemented on a 24/7 basis the projection is that road transport related NOx emissions will be reduced by 57%. Alternatively, if it follows the Congestion Charge times (7am – 6pm Monday to Friday) the expected reduction would be 27%.
Acknowledging that the inclusion of private vehicles in the ULEZ would be controversial, Pencharz is resolute: “We think six years notice is a long time and enables the market to adjust long before the proposed ULEZ comes into effect. Some people want the ULEZ to be introduced within a year but we think that’s unreasonable as residents and businesses have bought vehicles in good faith and they need a decent amount of time to make the necessary changes. Furthermore, the economic and political impact would not be acceptable, especially as some of these measures can be regressive and hit the poorer households hardest. The Mayor has to balance a lot of factors.”
Like many cities, London is divided by a river which concentrates roads, rail, metro and pedestrian traffic giving rise to congestion at these crossings - including at the Blackwall Tunnel. “The Blackwall Tunnel is one of the worst pinch-points in the country and with a large number of queuing vehicles the air quality in the Greenwich/Woolwich area is quite a problem. We can’t carry on like that. So while there is little scope for large road building in London, we have proposed a new crossing to ease congestion in the Blackwall Tunnel area.”
Mayor Johnson is particularly known for commissioning a new double decker bus, his pro-cycling views and the setting up of a bike hire scheme that now offers more than 10,000 pedal cycles spread across 1002km of Central London. Bicycles can now account for up to 25% of traffic in the morning peak. But the increase in cycling has not been achieved without incident as was tragically illustrated in a two week period in November 2013 when six London cyclists were killed in separate incidents.
“Every death is awful but statistically speaking the overall accidents rate for 2013 was average and the trend has been declining over the years. What was particularly awful was that these fatalities happened extremely quickly after having had very few in the previous months. That may sound cold but you can’t make policy off the back of one month’s figures, as bad as they were, and I as I said, over time we have seen the number of KSIs [killed and seriously injured] coming down.
“We are sorting out poorly designed junctions that are particularly difficult for cyclists but you have to consider the impact on other road users too. We are seeing transformational schemes and it takes time to find the right balance for all road users.”
TfL is to accelerate the installation low level cycle signals at key junctions across the capital and is also leading by example having pledged that all its traffic signals will use energy efficient LEDs in the future.
It is yet to be seen if the measures being implemented will mead to compliance with European air quality standards but the fact remains that London is setting a credible example to other cities looking to tackle pollution.
Box Travel in London
For over a century London’s commuters have had many travel options so although large numbers of people travel into central London each day, only a relatively small proportion do so by car. London Underground is now 150 years old, has 400km (250 miles) of track (half of which is above ground), 270 stations and carries around 1.25 billion passengers per year. There are a further 83 main line stations with the busiest, Waterloo, handling 82 million passengers per year. And there 70 million pre-payment Oyster cards have been issued.
London’s streets also host 23,000 of the famous Black Cabs and 8,750 buses which carry more than 2 billion passengers per year.
Bus retrofit
In the trial aimed at reducing NOX and NO2 emissions along Putney High Street, 93 London buses based in the Putney bus garage were retrofitted with a selective catalytic reduction system adapted for urban driving conditions. Studies by the contractor showed that these buses accounted for around half of all bus and coach movements along Putney High Street - the remainder being either hybrid (5%) or with factory fitted emissions control technology.
During the monitoring period 450,000 unique registration plates were captured and 2.6 million paired (north and south bound) journeys were recorded. Buses and coaches comprised 14% of the total vehicles recorded, 0.9% were heavy goods vehicles and there were 40 plant/construction vehicles per day.
Following the retrofit, and with meteorology effects removed, kerbside concentrations of NOx and NO2 fell by 24% and 23% respectively (to 283 and 112µg/m3) but within three months the levels increased again to 348 and 128µg/m3.
Due to the nature of the NO2 reduction the number of hourly exceedences of the 200μg/m3 EU Limit threshold per month was more marked than the reduction in mean concentrations. This resulted in 42% and 71% fewer exceedences at the kerb and façade (respectively) compared with the same period a year earlier.


