Transport for London (TfL) is the integrated transport authority responsible for transport in London, UK. It’s the body in charge of the day-to-day operation of London’s public transport network - and of all of London's busy main roads.
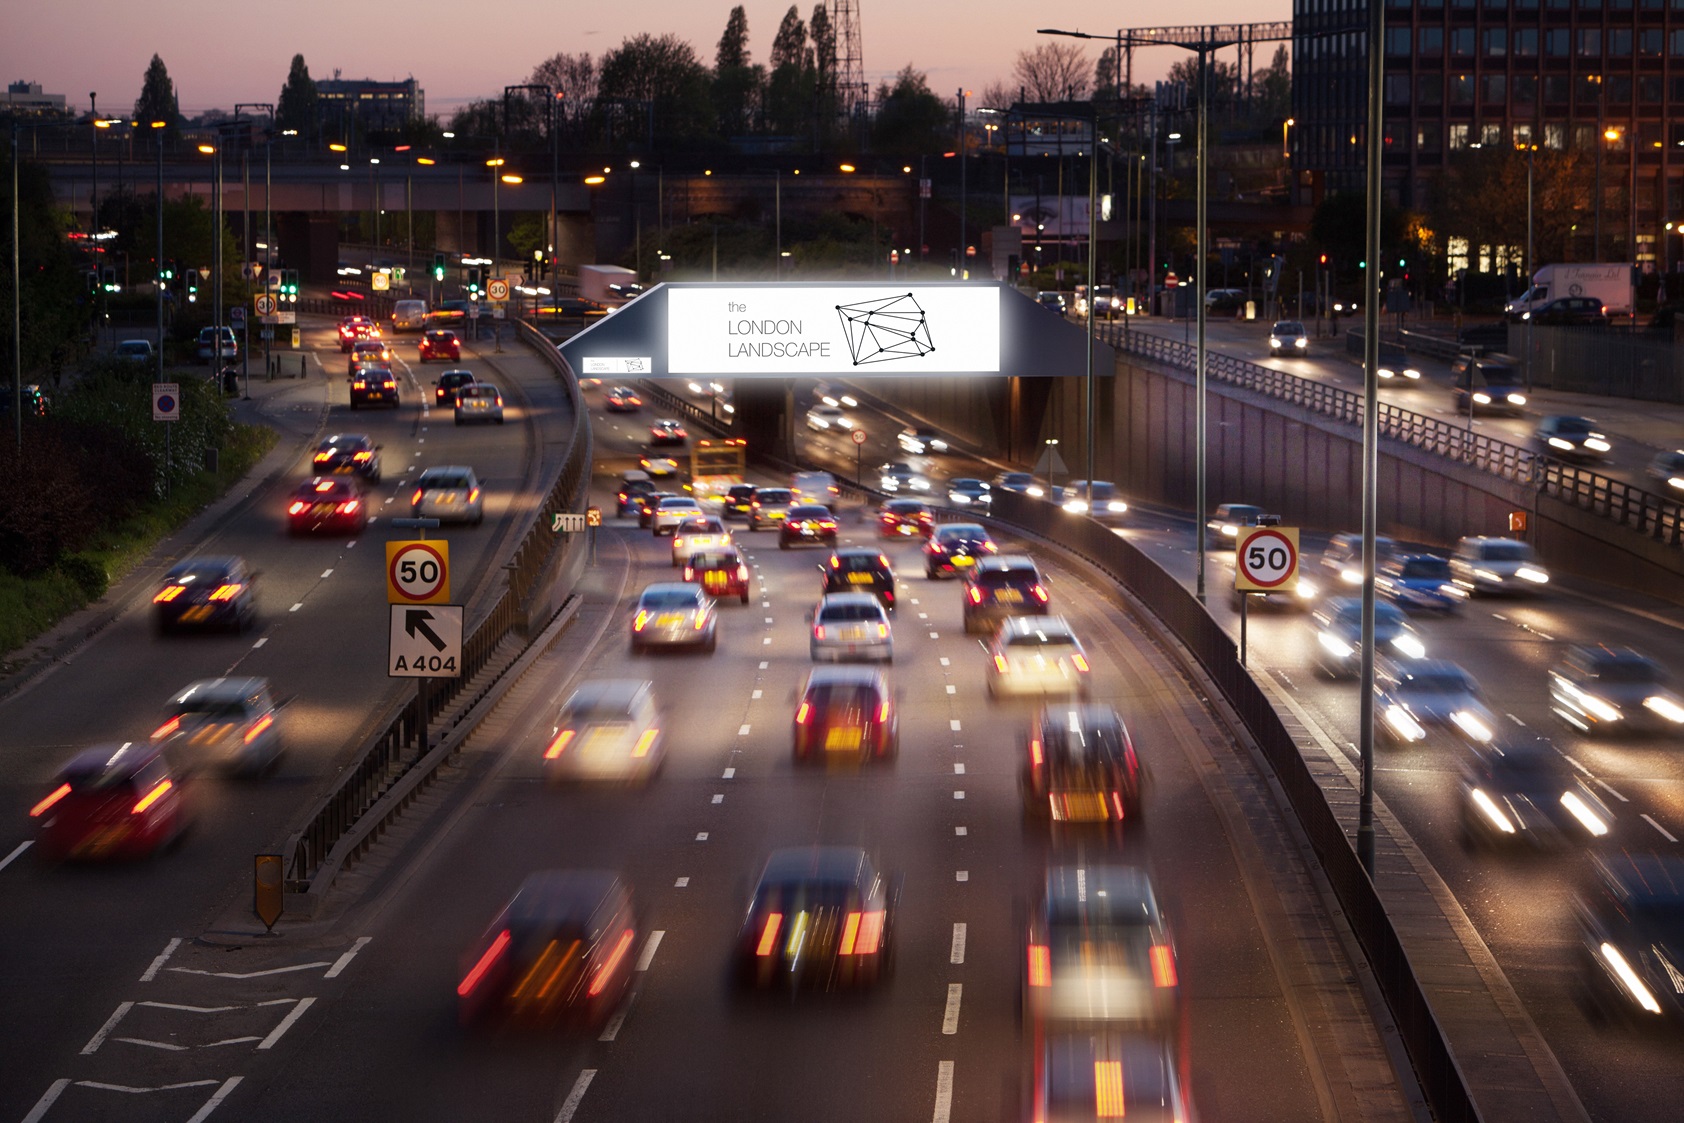
That’s no easy job. TfL data suggests that on an average day, London residents make 4.6m car driver trips and 1.4m car passenger trips. If you add in the one million journeys non-residents make, then that is around five million journeys a day. In fact, as much as we love the London’s metro system – the Tube - around one in eight of journeys in London actually take place on the road network, says TfL.
That equates to over 3.7 billion trips per year, so there is a lot to manage and keep moving efficiently, says the organisation’s chief transport analyst Andy Emmonds.
Managing this network is a deeply complex, intricate challenge. In fact, monitoring it is a technical feat when you consider there are 65,000-plus roads. Reacting to incidents is even more of a challenge, but essential. London experiences 20,000 transport incidents yearly - and each minute left unaddressed means traffic jams build exponentially.
“Breaking a traffic jam within seconds rather than minutes would save the city and drivers huge amounts of time”
There is a serious cost to road inefficiency, which Mayor of London Sadiq Khan (who has ultimate responsibility for transport in the capital) is acutely aware of. It is estimated that congestion costs London £5.1 billion per year in lost productivity. Per driver, says TomTom, that equates to at least £1,211 a year. But the negative consequences of jammed-up streets go way beyond that. There’s also huge stress and inconvenience for road users, pedestrians, and residents.
In response, TfL is on a mission to find ways to ensure that London’s nine million residents and 20 million annual visitors can travel safely and easily—moving London forward in a healthy, inclusive and sustainable way. The aim is to mitigate the environmental and health impact caused by slow-moving traffic, particularly the concerning levels of CO2 emissions.
The immediate challenge was the prolonged time it took for TfL to detect incidents, ranging between 14 and 17 minutes. By the time interventions were in place, an average of 27 minutes had already been lost due to traffic build-up. Each minute saved in addressing incidents holds significant financial value, amounting to thousands of pounds.
Emmonds and his team believe they have identified a strategy to begin recovering those financial losses at long last.
A virtual reproduction
The idea is to aggregate real-time data on all those roads and spot an incident not when it appears on CCTV in the TfL traffic control centre, but as it’s about to become a problem. This will address the issue before the situation escalates.
Emmonds highlights the significant advantages of such a capability: breaking a traffic jam within seconds rather than minutes would save the city and drivers huge amounts of time, as well as reduce the pollution created by stationary vehicles.
He has been exploring two advanced forms of computer simulation and modelling to address these challenges: a digital twin and graph technology. A digital twin is a virtual reproduction, with a high level of detail and real-time data feeds to mirror a real-world process.
In TfL’s case, the digital twin represents the actual transport network, in which different scenarios can be tested and evaluated.

Emmonds decided the best way to build his planned system was to work with a graph database. The conceptual roots of the approach go back to a branch of mathematics, but the point of graph technology is the idea of a network. When we say network here, we're describing a method to depict various entities for storing information while also modelling the connections and relationships between them
By design, graphs enable people to store and examine the connections between data points as data itself—much in the same way commuters think about the routes and connections in their daily travel. “We found that real-time data can only be solved by a graph database because a graph database is an agile and adaptive way to interpret granular data at scale,” Emmonds says.
He acknowledges that to fully leverage digital twin and graphs, his organisation's approach to utilising data had to be overhauled, emphasising the transformative role that data plays in realising the potential of such innovative technologies.
“For a long time, we took a totally reactive approach to data,” he says. A persistent historical challenge to using a digital solution to solve London’s congestion problem was the prevalence of low-quality and fragmented travel data. Many of the journeys TfL needs to track involve private and multimodal transportation (e.g. citizens or tourists may drive or cycle, then catch a train, then walk), making them hard to compile and track.
“Many of the journeys TfL needs to track involve private and multimodal transportation, making them hard to compile and track”
Before adopting the digital twin and graph approaches, TfL's strategy involved collecting separate data sets, limiting its ability to address the full spectrum of questions the team wanted to explore. The challenge wasn't a lack of data—they were accumulating terabytes of data every week. However, due to the way this data was stored and analysed, meaningful conclusions couldn't be drawn based on the relationships within these datasets.
In addition, not having enough on-road sensors to gather fresh data, like cameras and telematics, often meant that TfL only received insight into traffic incidents once they had been visually spotted. Emmonds explains: “We were effectively using this disparate data through Excel sheets, and none of this data was aligned or real-time. What we needed was to be a real-time operator, and to do that we needed a digital twin.”
Real-world ‘connection’
The emphasis on tracking relationships is a key concept in this scenario. Emmonds is clear that graphs represent the most efficient, cost-effective, and performant way to uncover hidden relationships and patterns across billions of data connections to make the decisions needed to predict and handle traffic incidents.
In a graph representation, a road link becomes a 'node'—an element within the graph. It’s a route from A to B that also has many properties, providing a more intuitive and comprehensive way to capture and analyse the complexity of transportation data. Unlike the cumbersome spreadsheets that TfL previously used, a graph-based approach is tailor-made for this type of analysis, making it easier to understand and work with the intricate relationships and properties associated with each road link. “Trips and routing can only be efficiently managed through such a database,” Emmonds says.
Testing was imperative. Emmonds explains: “We set up a test product which was fed data powered by graphs that could tell us in near real-time if there was a problem on the road. And on the day of the test, the system detected five incidents that the control room didn’t pick up. For us, that was the proof in the pudding.”
Overall vision
The TfL road traffic twin consists of five layers:
1. the first level of the model, where input data is aligned with the business challenge
2. the data is organised to solve the challenge
3. in the Neo4j platform, the data is set up so it mirrors the physical network it is modelling
4. the data is sent to TfL’s control room for interpretation
5. the data is used to solve different road problems.
TfL now connects and feeds its datasets into the digital twin, and the solution plays a crucial role in TfL’s overall vision of cutting congestion by 10%. If this ambitious goal is achieved, it would result in a productivity gain of £600m, equating to £1,211 in time per driver.
Using his new innovative technology stack, Emmonds also hopes to streamline peak traffic events, such as a major football matches or music concerts. The goal is to enhance the planning and controlling of routes across the network driven by data.
In the medium term, TfL aims to leverage the solution to develop data-driven and effective emission reduction strategies for London. Looking ahead, there are aspirations to use this technology as a basis for establishing an autonomous vehicle network.
Emmonds concludes: “The next step is making London’s roads autonomous and green.”
And as the great thing about a solution like this is that the architecture is open and agile, there’s “nothing stopping us” from using it to build and understand the metropolis of the future.

ABOUT THE AUTHOR
Aaron Holt is enterprise account executive at graph database and analytics company Neo4j


