")
The Connecticut Transportation Safety Research Center (CTSRC) is one part of the Connecticut Transportation Institute housed in the College of Engineering at the University of Connecticut (UConn). Its primary mission is to support the Connecticut Department of Transportation (CTDoT) in developing and maintaining a state-of-the-art crash collection and safety analysis system.
As part of that mission, the Center has developed the Crash Repository for Analytics, Statistics and History (Crash). Through a series of geographic information system (GIS)-based dashboards, Crash provides a comprehensive view of the crash, person and vehicle data within the state of Connecticut. All the information available in the dashboards is refreshed on a daily basis to keep it as current as possible.
Crash course
The journey to the current application started with the use of crash data analytics in 2011 with the Crash Data Repository which presently has just under 2.7 million crashes that date back to 1995 and provides the underlying data for the Crash application. An advantage that Connecticut has, according to Dr. Eric Jackson, executive director of the Connecticut Transportation Institute and director of the CTSRC, is that all data gathered by the state is made publicly available. This makes realisation of a project such as Crash a far simpler task than in other locations where engineers can struggle to access the same levels of information.
The Center brought on board two specialists of its own - Aaron Nash as the GIS project manager and Jennifer Pawelzik as the GIS database administrator. The team expanded to include several PhD students to help bring the vision to life.
During the development of the tool, there were several permutations of trial and error within the application. “Several previous solutions were tried,” says Nash. “Performance of dynamic views was sub-optimal, and prone to time-out errors. We tried creating the geometry of the crash location using Python and later changed it to build the geometry using SQL.” The methodology the team finally landed on is a stored SQL procedure that is scheduled to run nightly. This updates a series of feature classes that are published as dedicated feature services.
A first-phase solution provided crash-level location information for each emphasis area and was designed simply to provide a GIS front end to complement the Crash Data Repository. However, this has since been significantly expanded in phase two, which added more person-level (age, gender, physical condition) and vehicle-level (body type, age, levels of damage) data.
In total, there are 26 data queries for each focus of the data providing insight on different types of crashes - termed ‘emphasis areas’. The goal according to Nash, “is to provide a full and comprehensive view of the MMUCC data in an easy to access format”.
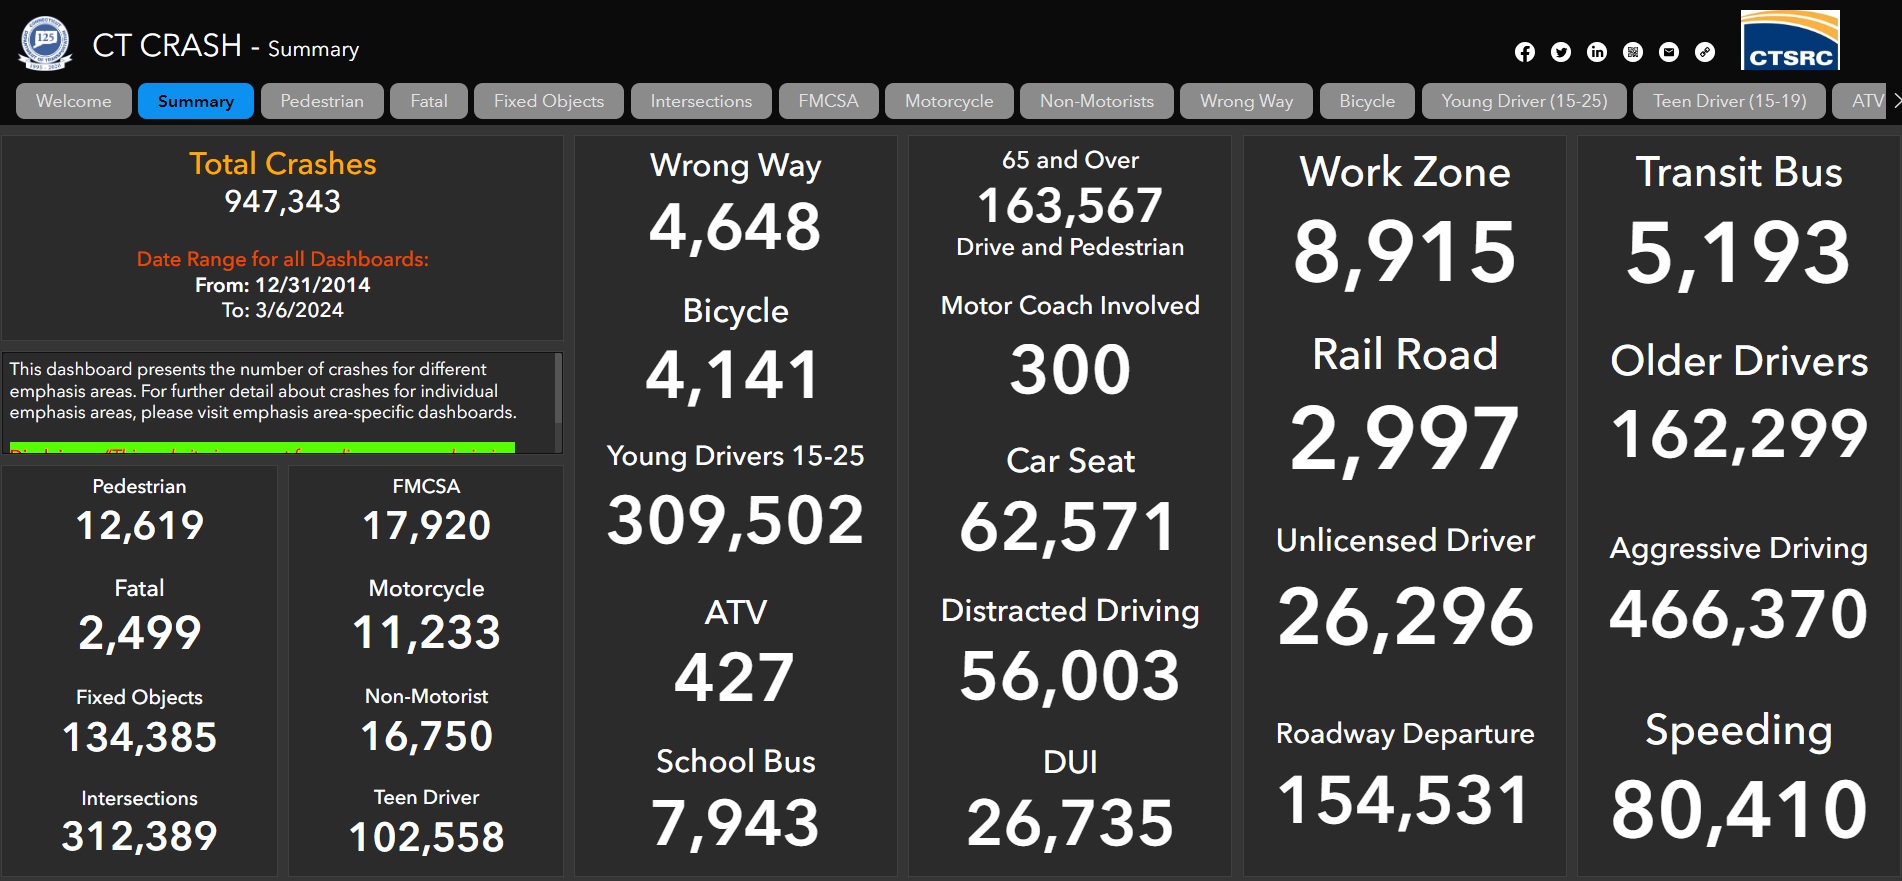
A separate service shows summary metrics which provide a high-level view of events.
“Grant support is available for red-light camera installations at intersections, but local jurisdictions need to be able to supply data for why they have selected specific locations”
Growing asset
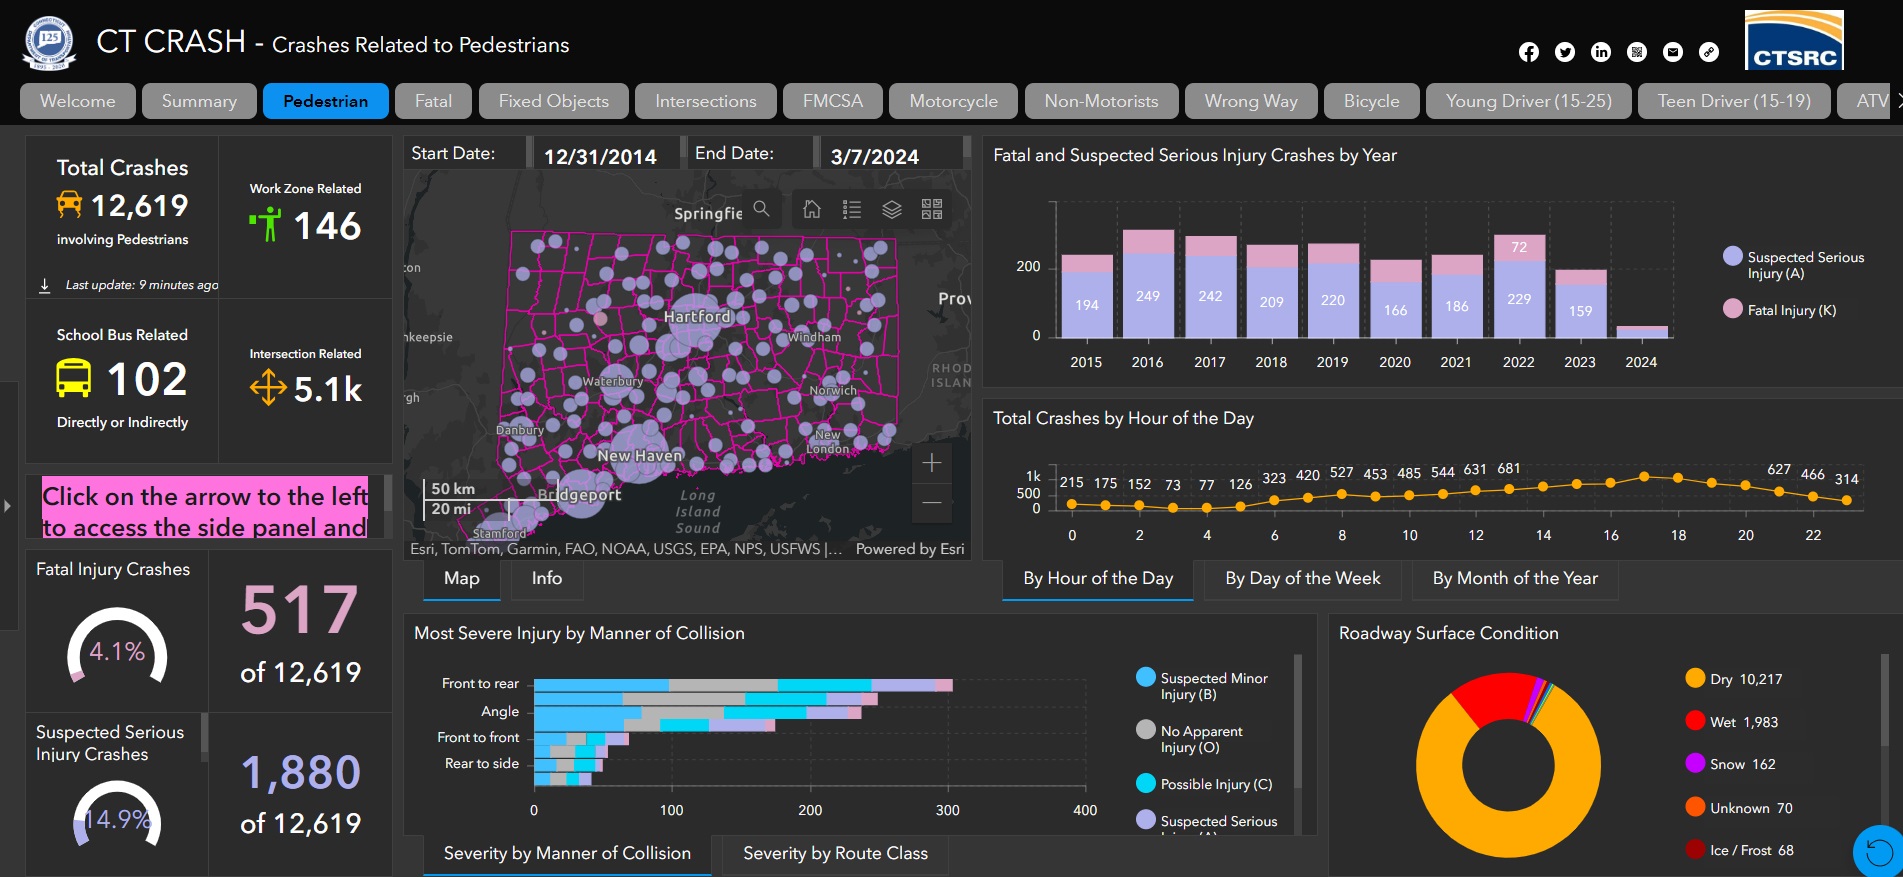
How the data has been built up over time can be illustrated with the pedestrian emphasis area as an example. In the crash-level view of the data, users can access locational and temporal details, in addition to information on circumstances contributing to an incident - such as the manner of collision, the roadway surface condition and injury severity level. With the latest updates to the application, users can now view information specifically pertaining to the person- and vehicle-level view of the crash. For each of the 26 emphasis areas, there are queryable dashboards centred around the way the data is typically presented and analysed by safety analysts.
Access to the information is via a homepage which is designed to present information in an easily digestible format. A Story Map was developed with background on the data and instructions on how to navigate the application to ensure that even those who are unfamiliar with GIS and crash data are still able to access the information they require.
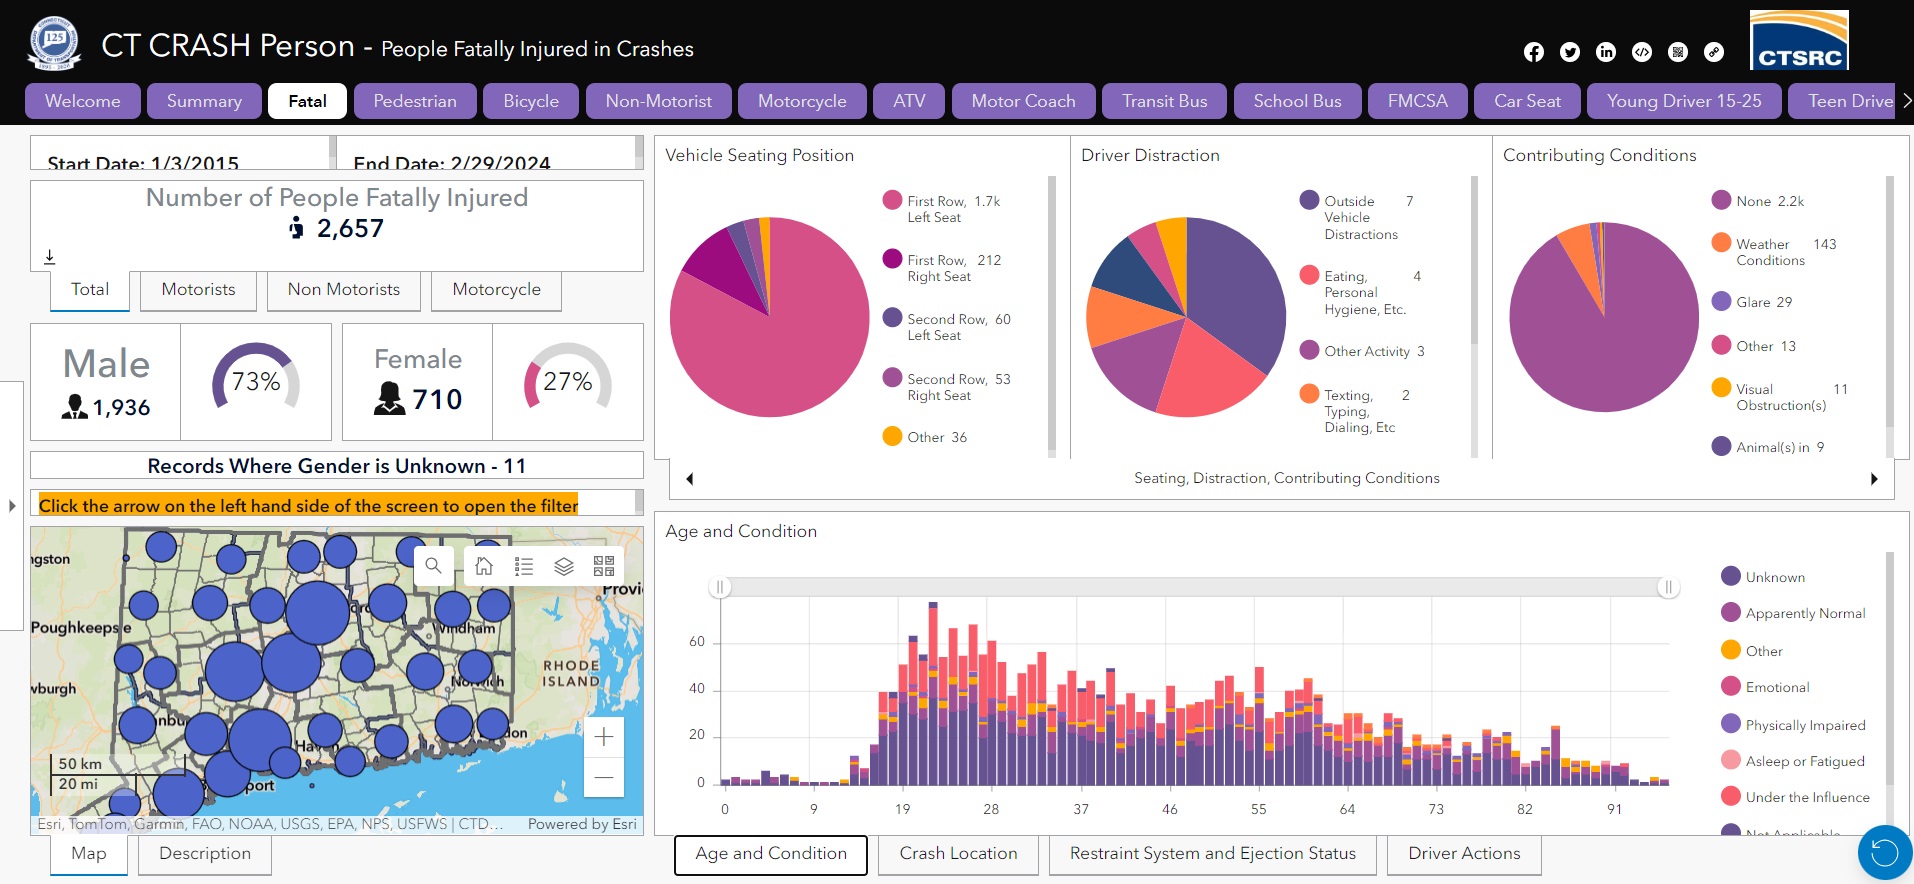
The Story Map is broken out into multiple sections describing the navigation of the dashboards, emphasis area definitions, rest service access, and information on the Crash Data Repository. This was built out based on a combination of frequently asked questions and to show the underlying metadata used for Crash. The goal of the Crash application is to provide front end users with convenient access to commonly-requested data queries that can be further drilled down using the filter options. As an example, if a user wanted to see all fatal and serious injury crashes involving a non-motorist in their town, they could navigate to the person-level non-motorist dashboard and set the filters accordingly.
The development of the dashboards was accomplished using both Esri’s ArcGIS Experience Builder and Dashboard applications. The Crash team’s migration to ArcGIS Enterprise 11.2 has added functionalities, such as the ability for users to download data, a mobile dashboard view, and a reset option.
Adding and verifying data
CTSRC has a standardised crash data workflow that pulls data from an SFTP site nightly. This enables daily updates. To ensure data accuracy, a team of crash coders scrutinises each crash reported for location checks and general report errors. Esri tools are used to geolocate incidents and cross reference the locations from reporting officers based off fields within the crash report and the crash diagram.
The review process can take between 30-60 days for property damage-only crashes - but fatal, injury, and commercial vehicle crashes automatically jump to the front of the queue and are processed within 24 hours of receipt. Once a crash has been reviewed by the coders and marked as completed the information ends up in the crash data repository, and ultimately the Crash database.
With 110,000 crashes each year and a database that reaches back to 1995, the CTSRC is looking into how machine learning and artificial intelligence could be applied. This could include natural language processing of both the data itself for easier processing, but also leveraging AI to glean more information and insights from the intersection diagrams that accompany the crash reports.
Dr. Jackson notes that Connecticut’s data set is a unique asset, and one that is ripe for the application of machine learning and AI, as well as more advanced analytics. To that end, the Center has a number of graduate students, post-doctoral researchers and safety engineers who are focused on leveraging the data to help drive safety research.
“With 110,000 crashes each year and a database that reaches back to 1995, the CTSRC is looking into how machine learning and artificial intelligence could be applied”
End-user benefits
Just how all this helps CTDoT, and in particular local jurisdictions, is illustrated by the support the Center provides for Safe Streets and Roads for All grant awards.
“We’ve had a lot of requests for help with identifying which intersections are the most dangerous for pedestrians and cyclists,” says Jackson. “We’re starting to see impacts in terms of needing to demonstrate where our problems are, so that we can start finding countermeasures and solutions, and we’re right on the cusp of understanding how towns are going to start using this data to help improve their chances of getting funding.”
The Connecticut Roadway Safety Management System (CRSMS) and safety analysis tools, developed together with engineering consulting firm VHB, have the aim of improving those statistical methods and metrics; a next step is for Jackson and his team to organise a series of webinars which will help planning agencies better understand how to use these tools.
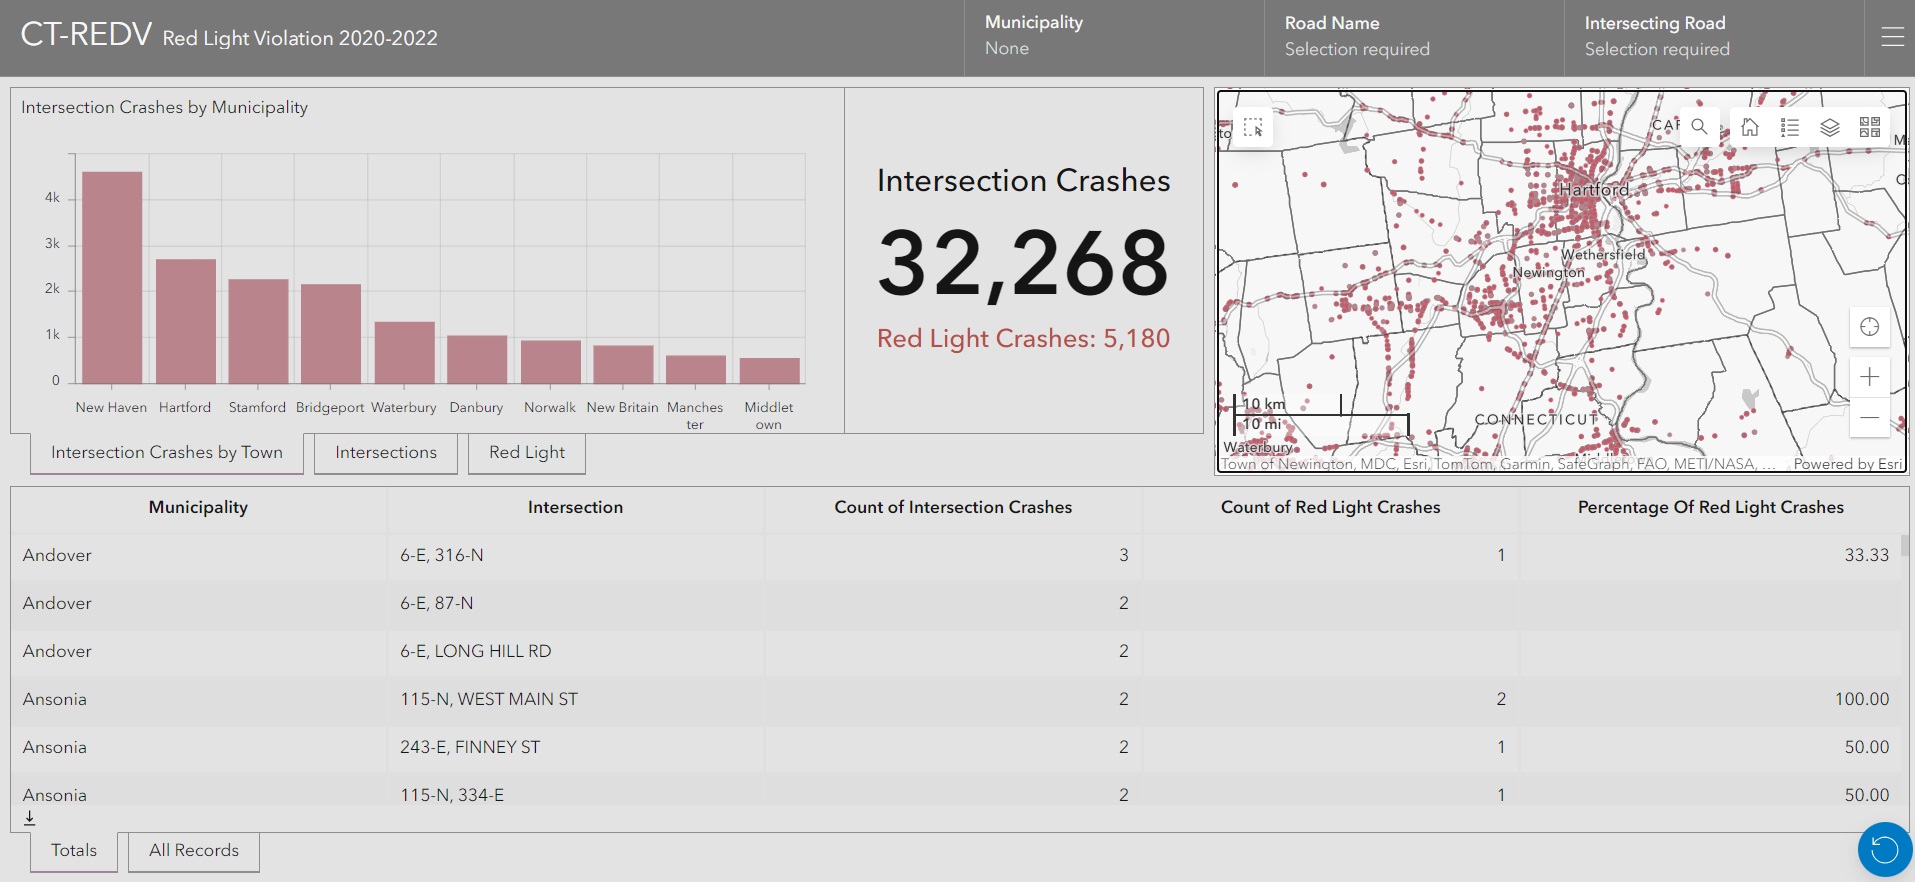
Having the crash data available in Esri’s ArcGIS Enterprise platform allows for the Crash team to leverage the crash data and build out derivative datasets and applications to address needs within the state. An example of this is the CT-REDV, a red-light violation application which provides information for signalised intersections throughout the state.
Grant support is available for red-light camera installations at intersections, but local jurisdictions need to be able to supply data for why they have selected specific locations.
Pawelzik took data from a time subset — January 2020 to December 2022 — for the build, although a wealth of data stretching back over quite some years has resulted in the ability to provide information for local as well as state roads. A challenge arose in terms of standardising the intersecting road names within the data, she says, depending on where precisely within an intersection a crash occurred could result in various combinations of road and route names being used on the crash report form.
Now, instead of having to comb through crash data, towns can see the data they need in a more digestible format. They can see the individual intersections which have sustained red-light crashes, to help them prioritise those intersections for red-light camera installations. All of this can be broken out and downloaded as needed, and Pawelzik says that the app provides a good example of the kinds of emerging requests that CTDoT receives from towns that the CTSRC is able to help with.
Positive reception
The use of the Center to collect and manage the crash data, allows the safety engineers at CTDoT to concentrate their efforts on the development of more effective safety measures, without having to shoulder the considerable burden of “cleaning, geocoding and validating” the raw data, and the effort to manage a crash database with close to three million records.
As a result, responses to the solutions provided by CTSRC have been very positive, especially among the towns which have long standing relationships with CTDOT and have been making regular data requests.
In particular, the migration to Enterprise 11.2 and the ability to download easily digestible information is proving to be a real bonus. And, although some of the information provided is highly granular, the presentation in GIS is proving useful to jurisdictions helping them not only better understand their safety performance, but also to be more strategic when looking to make infrastructure and safety improvements.


")
")
")

")
")
")
