Like other US state departments of transport, the Colorado Department of Transportation (CDoT) is charged with maintaining road infrastructure and — most importantly — with improving safety and the journey experience for travellers. CDoT’s vision is to enhance quality of life and the environment by creating an integrated transportation network. However, like other state DoTs, it also has to contend with budgetary constraints and the expectation that more be achieved with less.
In 2017, CDoT officials took steps to address this apparent conflict. Realising that knowledge truly is power, as well as a potentially significant money saver, they took a considered look at how the assets within their purview could be made to work far smarter, rather than just harder.
They recognised that 21st century DoTs operate in an ever-changing environment and a growing data landscape. If properly utilised, they reasoned, data could successfully address the ‘more with less’ conundrum.
A new position, chief data officer, was established as CDoT sought to create a strong, sustainable foundation for its future data needs. As almost everything about transportation is related to location, geographic information system (GIS) specialist Esri was chosen as the partner for a new system of engagement (SoE).
Intelligence-led
The Esri ArcGIS solution underpinning CDoT’s data effort enables several things. In particular, ArcGIS facilitates information from many sources and providers to be brought together seamlessly in a single place. The resultant, tightly integrated and extremely rich information source can then be accessed and viewed simply and quickly via common browsers and applications. These offer unprecedented levels of detail.
Individuals with the appropriate permissions can draw upon, use, add to or otherwise influence information from right across an organization - not just that generated or owned by their own departments. The consequent removal of institutional barriers results in across-the-board performance improvements.
What that means for CDoT, says chief engineer Joshua Laipply, who has been one of the driving forces behind the SoE’s development, is that business decisions over when and where to invest in infrastructure maintenance and improvement can now be led by the head and not the gut.
“Historically, many of our field personnel’s investment recommendations were based on anecdotal evidence — their ‘feel’ for what was going on. Now, decisions are much more intelligence-led. As an example, because we can overlay detailed information on specific weather events and actions taken, we know precisely where snow ploughs have salted the roads. We can gain a far better idea of the likely locations of pavement deterioration caused by chemical processes, and where we might need to intervene. We’re shifting to a more proactive stance in infrastructure management and advancing operational excellence.”

Implementing change
CDoT’s data-enrichment effort began with an assay process. It took a detailed look at what was already in existence, reviewing data quality. The dashboards, viewers and mobile apps developed through the SoE enhance data quality by identifying gaps and repetition as data is being viewed more widely; post-assay, enhancing data quality is a continuous process.
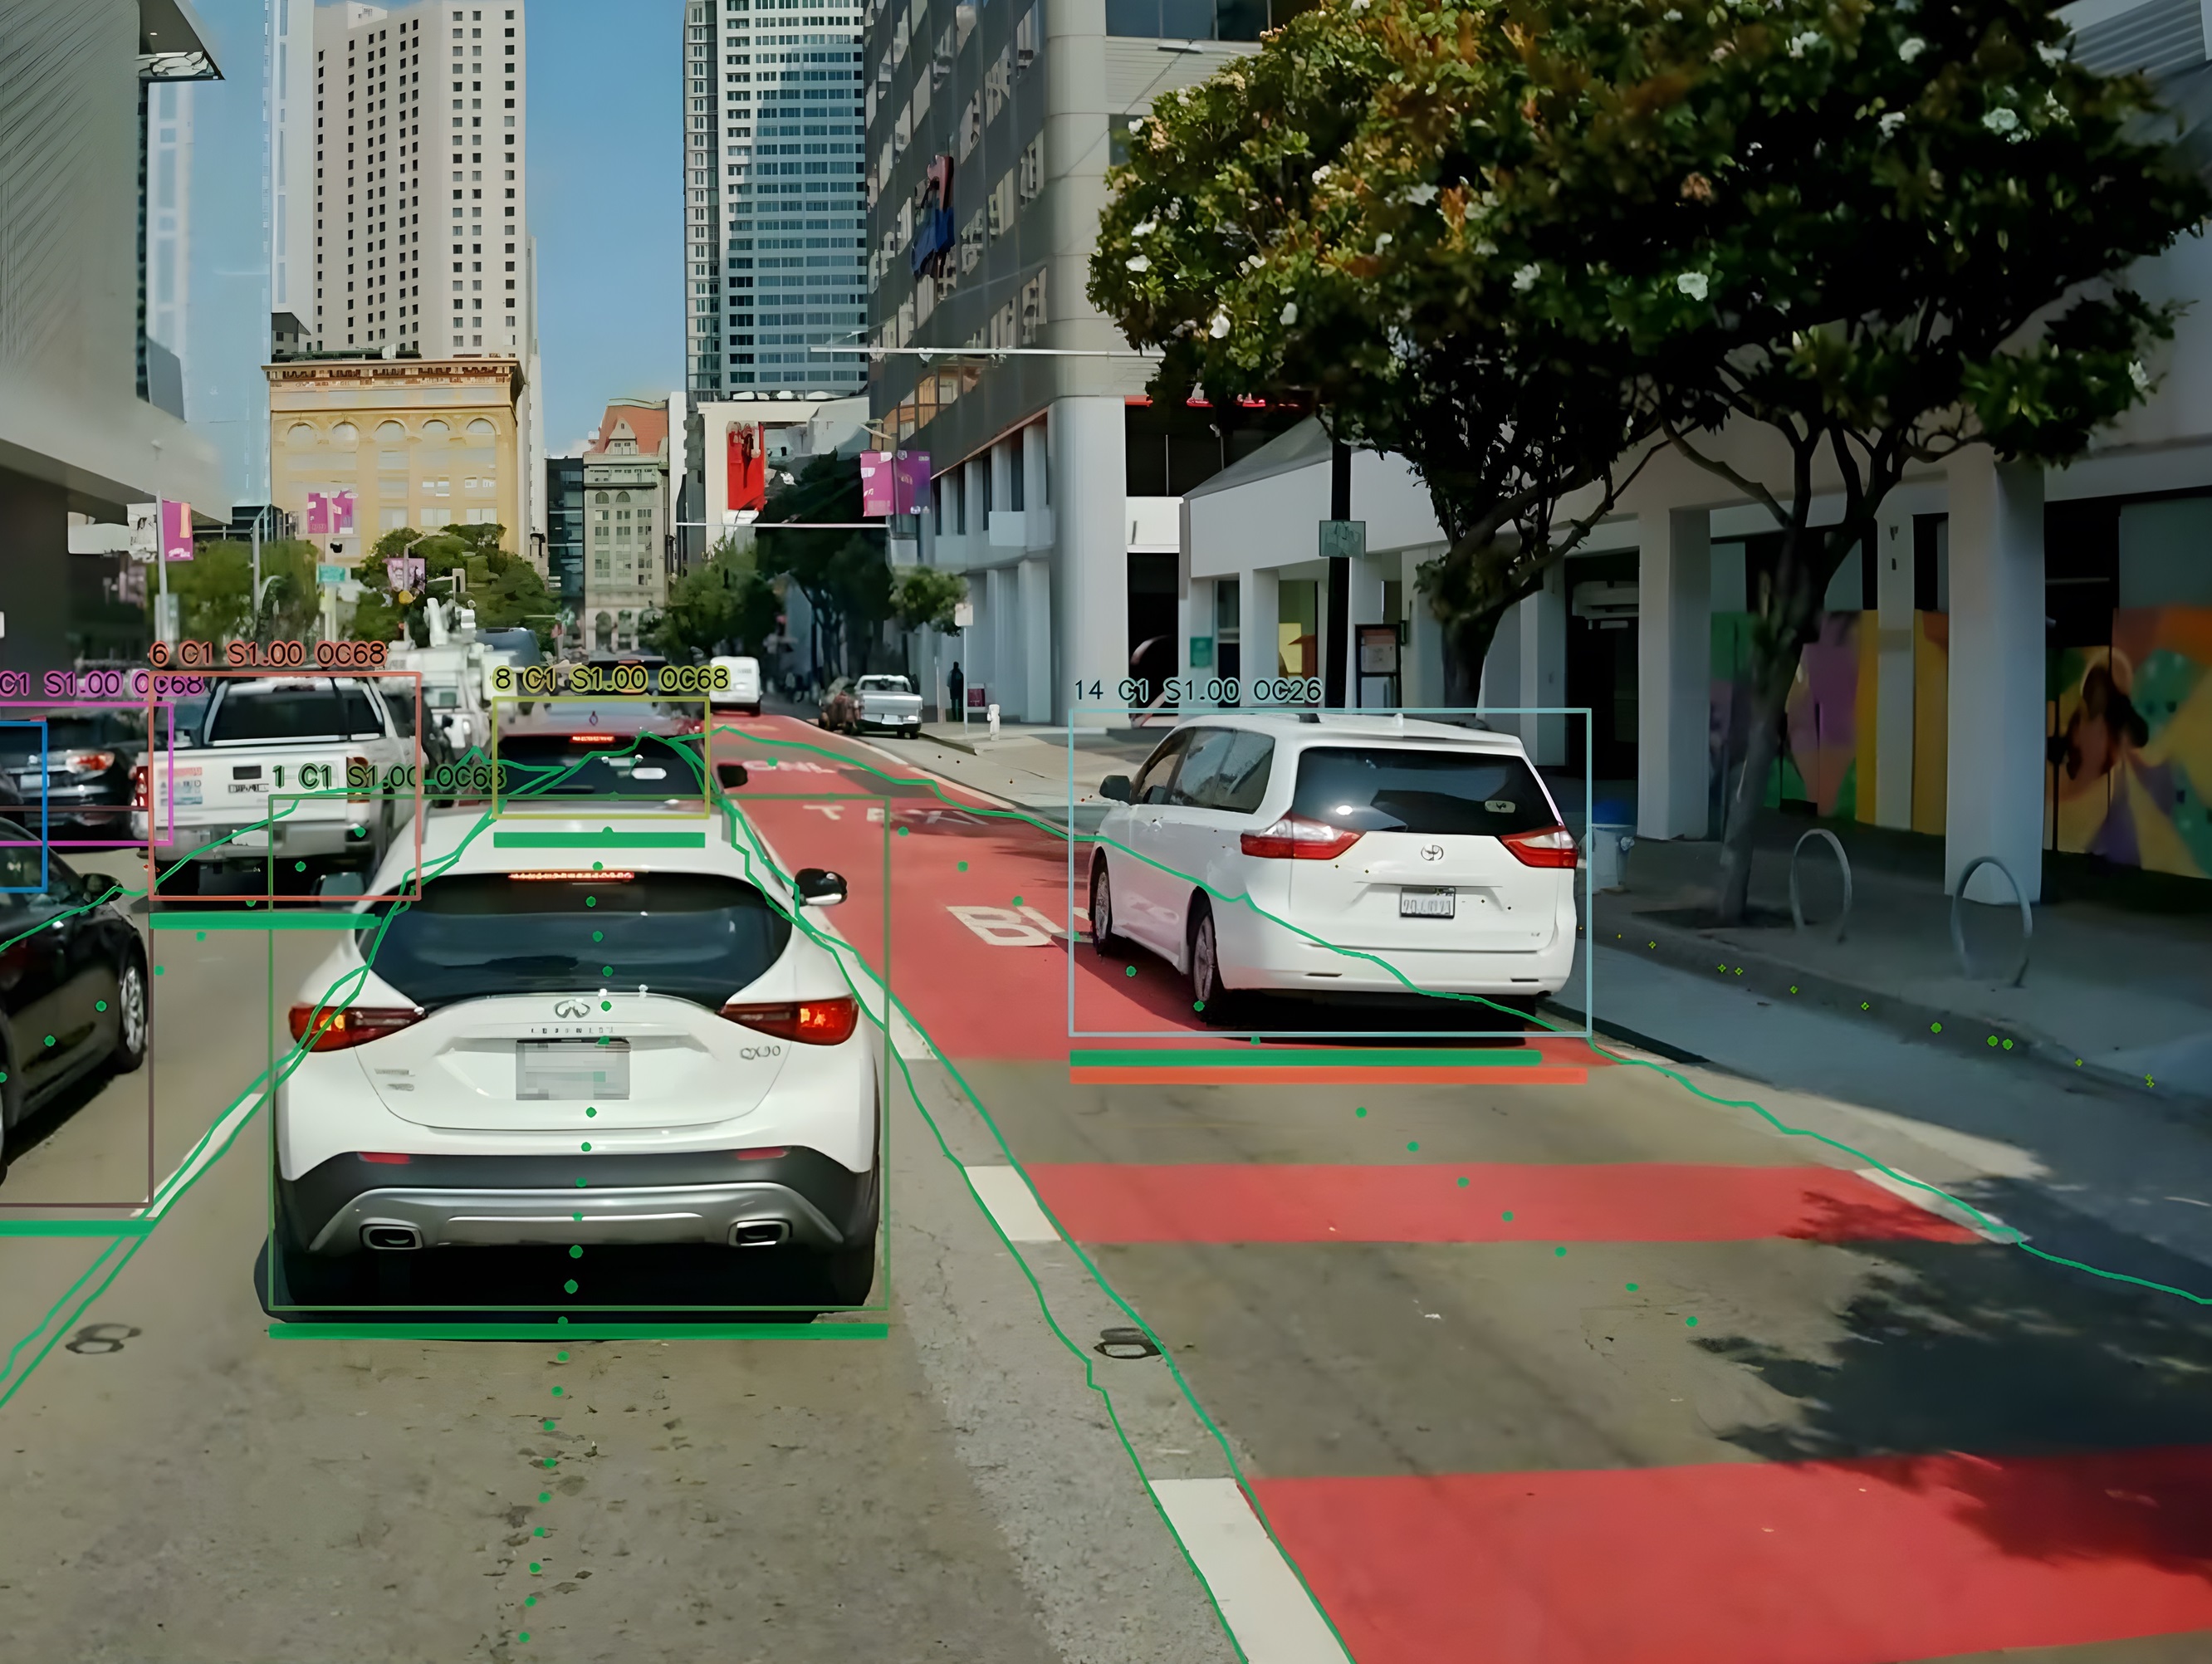
As well as improving things from an asset-management perspective, CDoT is also working to bring in sensory elements which will improve its real-time and predictive traffic and incident management performance. This includes drawing on information gathered and shared by first responders, tow trucks, the automatic vehicle location systems on winter maintenance vehicles and so on. Data availability will increase exponentially once connected and autonomous vehicles (C/AVs) become more prevalent.
Laipply says: “Road networks are becoming information networks but more data doesn’t necessarily make you smarter. It’s about how you pull it together and visualise things. At the same time, it’s important to acknowledge that opportunities for improvement could be missed if ‘excess’ data is discarded.”
New perspective
The new Esri SoE is a highly effective way of working, says Barbara Cohn, chief data officer, senior consultant. She sees the ability to readily prove and support good business use cases as critical to CDoT’s continuing development.
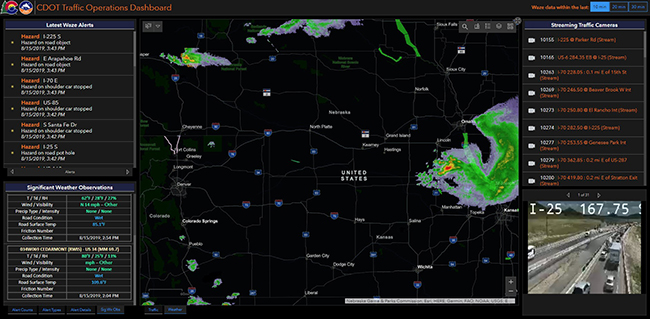
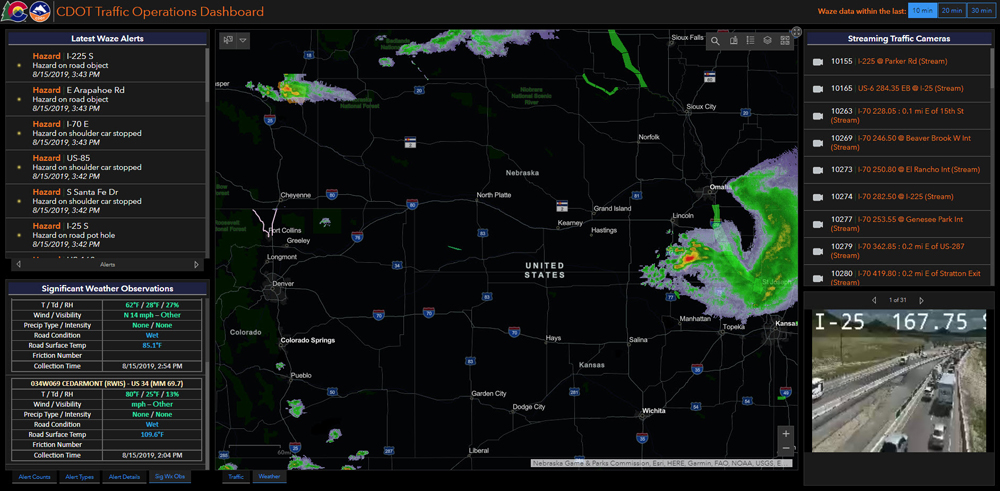
Cohn notes especially the ability to draw on information from disparate sources, including those from outside the organisation. To complement its traffic management operations, CDoT worked with Esri to access streams from private-sector providers such as Waze and Here. It is also possible to look further into the future — overlaying mapping information for new property developments, freight movements, demographics and more enables their effects on traffic patterns to be predicted and effectively managed.
“The ability to visualise vast amounts of information means that our understanding of what’s happening is much more acute,” Cohn continues. “Visualisations help identify trends, distill increasing amounts of information, and transform raw data into actionable insight. The SoE is breaking down data silos and providing a holistic view of the transportation network. Having the opportunity to look at all data, not just some, is inspiring new, creative and cooperative problem-solving. By using the common language of geography, we’re really getting down to the ‘what, how and where’. It’s important to note that these are not the static GIS maps of old; our solutions are far more dynamic and interactive, allowing personnel to drill right down to the granular level. We’ve also digitised and automated targeted manual processes, and made qualitative and quantitative improvements. Our data’s more accurate and it’s now being updated more regularly.”

Swifter solutions
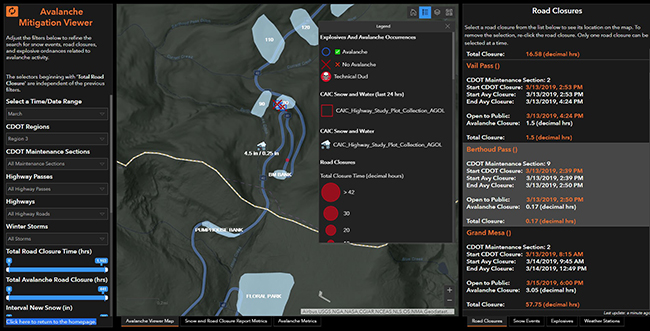
Once the case has been made for an application’s development, an assessment is made of the data needed to support it. Colorado’s geography gives rise to a rather more unusual safety and operations-related app which helps to demonstrate the versatility and variety possible using ArcGIS, as well as the utility of a typical app. The state encompasses most of the Southern Rockies and CDoT has some 35 mountain passes which it has to keep open across the winter. To help control the threat of avalanches, it uses explosives as well as a 105mm howitzer, which fires 40lb shells, to dislodge potentially dangerous snow build-ups.
“2018 was a record year for avalanches and we needed a way to track which avalanche paths were most likely to cause disruption. We also needed to know where to plant and, if necessary, recover explosives,” Laipply explains. “By using the app, our field operatives no longer have to carry with them 10 years’ of hand-written notes. Via a smart device they have all that information at their fingertips and know exactly where to aim or search for expended ordnance. Our reactions to events are far faster and more effective. A big plus of the SoE is that it’s fast — we can have an initial version of an app ready in just a couple of weeks, or we can scrap failed ideas without significant cost. That means there’s no reason why we can’t create 40, 60 or even 80 apps to help people do their jobs.”
Cohn continues: “The technology is reusable and the apps are configurable with little or no custom code. Because we can fail fast and fail small, people at all levels are becoming more creative. By democratising data, we’re getting to that ‘boots on the ground’ knowledge which is so important.”
Adding value
In addition to being able to make best-value investment decisions, CDoT is enjoying an uplift in its real-time traffic management operations. Also, as well as the short-term, more tactical improvements to performance, there is the potential to make some rather profound longer-term gains.
“As we get more data from new sources, deploy more sensors and gain more information from C/AVs, so we’re going to be able to change how we design roads,” Laipply states. “At present, design is based on books, empirical formulae and graphs — the right radius, right camber and so on. Next, we’ll take data direct from C/AVs on such as pavement conditions and lane departures. We’ll be able to design specific to locations and so improve performance and safety.”
To conclude, Cohn offers an insight from history. “When John Snow helped to arrest the City of London’s cholera epidemic in the 19th century, he did it by identifying and locating polluted water pumps. The importance of mapping and analytics to the discovery of new insights and actionable knowledge has been recognised for a long time and cannot be over-emphasised — especially for the most complex situations. The use of GIS is allowing us to future-proof ourselves in terms of data sources. It’s helping to improve real-time operations and puts us on the cusp of better design. In the midst of perpetual change. Esri talks about ‘the science of where’. It’s location intelligence. That’s the golden nugget which inextricably links us all and allows us to reach deeper.”


